The percentage of U.S. college freshmen claiming no religious affiliation has risen in recent decades. The bar graph shows the percentage of first-year college students claiming no religious affiliation for four selected years from 1980 through 2010. Use this information to solve Exercises 47-48. a. Estimate the average yearly increase in the percentage of the first-year college males claiming no religious affiliation. Round the percentage to the nearest tenth. b. Estimate the percentage of first-year college males who will claim no religious affiliation in 2020.
The percentage of U.S. college freshmen claiming no religious affiliation has risen in recent decades. The bar graph shows the percentage of first-year college students claiming no religious affiliation for four selected years from 1980 through 2010. Use this information to solve Exercises 47-48. a. Estimate the average yearly increase in the percentage of the first-year college males claiming no religious affiliation. Round the percentage to the nearest tenth. b. Estimate the percentage of first-year college males who will claim no religious affiliation in 2020.
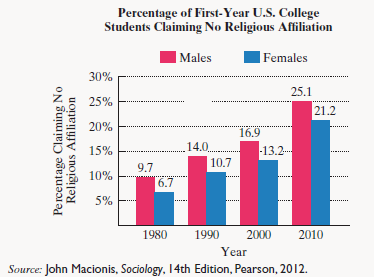
The percentage of U.S. college freshmen claiming no religious affiliation has risen in recent decades. The bar graph shows the percentage of first-year college students claiming no religious affiliation for four selected years from 1980 through 2010. Use this information to solve Exercises 47-48.
a. Estimate the average yearly increase in the percentage of the first-year college males claiming no religious affiliation. Round the percentage to the nearest tenth.
b. Estimate the percentage of first-year college males who will claim no religious affiliation in 2020.
Need a deep-dive on the concept behind this application? Look no further. Learn more about this topic, subject and related others by exploring similar questions and additional content below.
Discrete Distributions: Binomial, Poisson and Hypergeometric | Statistics for Data Science; Author: Dr. Bharatendra Rai;https://www.youtube.com/watch?v=lHhyy4JMigg;License: Standard Youtube License


 Algebra: Structure And Method, Book 1AlgebraISBN:9780395977224Author:Richard G. Brown, Mary P. Dolciani, Robert H. Sorgenfrey, William L. ColePublisher:McDougal Littell
 Holt Mcdougal Larson Pre-algebra: Student Edition...AlgebraISBN:9780547587776Author:HOLT MCDOUGALPublisher:HOLT MCDOUGAL
 College Algebra (MindTap Course List)AlgebraISBN:9781305652231Author:R. David Gustafson, Jeff HughesPublisher:Cengage Learning