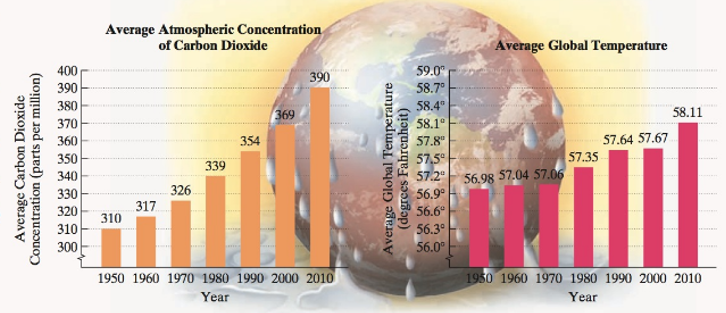
a. Estimate the yearly increase in the average atmospheric concentration of carbon dioxide. Express the answer in parts per million, rounded to the nearest hundredth. b. Write a mathematical model that estimates the average atmospheric concentration of carbon dioxide, C , in parts per million, x years after 1950. c. If the trend shown by the data continues, use your mathematical model from part (b) to project the average atmospheric concentration of carbon dioxide on 2050. There is a strong scientific consensus that human activities are changing the Earth's climate. Scientists now believe that there is a striking correlation between atmospheric carbon dioxide concentration and global temperature. As both of these variables increase at significant rates, there are warnings of a planetary emergency that threatens to condemn coming generations to a catastrophically diminished future. The bar graphs give the average atmospheric concentration of carbon dioxide and the average global temperature for seven selected years. Use this information to solve Exercises 51-52.
a. Estimate the yearly increase in the average atmospheric concentration of carbon dioxide. Express the answer in parts per million, rounded to the nearest hundredth. b. Write a mathematical model that estimates the average atmospheric concentration of carbon dioxide, C , in parts per million, x years after 1950. c. If the trend shown by the data continues, use your mathematical model from part (b) to project the average atmospheric concentration of carbon dioxide on 2050. There is a strong scientific consensus that human activities are changing the Earth's climate. Scientists now believe that there is a striking correlation between atmospheric carbon dioxide concentration and global temperature. As both of these variables increase at significant rates, there are warnings of a planetary emergency that threatens to condemn coming generations to a catastrophically diminished future. The bar graphs give the average atmospheric concentration of carbon dioxide and the average global temperature for seven selected years. Use this information to solve Exercises 51-52.
a. Estimate the yearly increase in the average atmospheric concentration of carbon dioxide. Express the answer in parts per million, rounded to the nearest hundredth.
b. Write a mathematical model that estimates the average atmospheric concentration of carbon dioxide, C, in parts per million, x years after 1950.
c. If the trend shown by the data continues, use your mathematical model from part (b) to project the average atmospheric concentration of carbon dioxide on 2050.
There is a strong scientific consensus that human activities are changing the Earth's climate. Scientists now believe that there is a striking correlation between atmospheric carbon dioxide concentration and global temperature. As both of these variables increase at significant rates, there are warnings of a planetary emergency that threatens to condemn coming generations to a catastrophically diminished future. The bar graphs give the average atmospheric concentration of carbon dioxide and the average global temperature for seven selected years. Use this information to solve Exercises 51-52.
Definition Definition Relationship between two independent variables. A correlation tells the degree to which variables move in relation to each other. When two sets of data are related to each other, there is a correlation between them.
Need a deep-dive on the concept behind this application? Look no further. Learn more about this topic, subject and related others by exploring similar questions and additional content below.
Correlation Vs Regression: Difference Between them with definition & Comparison Chart; Author: Key Differences;https://www.youtube.com/watch?v=Ou2QGSJVd0U;License: Standard YouTube License, CC-BY
Correlation and Regression: Concepts with Illustrative examples; Author: LEARN & APPLY : Lean and Six Sigma;https://www.youtube.com/watch?v=xTpHD5WLuoA;License: Standard YouTube License, CC-BY


 College Algebra (MindTap Course List)AlgebraISBN:9781305652231Author:R. David Gustafson, Jeff HughesPublisher:Cengage Learning
 Glencoe Algebra 1, Student Edition, 9780079039897...AlgebraISBN:9780079039897Author:CarterPublisher:McGraw Hill
 Trigonometry (MindTap Course List)TrigonometryISBN:9781337278461Author:Ron LarsonPublisher:Cengage Learning