
Mathematical Statistics with Applications
7th Edition
ISBN: 9780495110811
Author: Dennis Wackerly, William Mendenhall, Richard L. Scheaffer
Publisher: Cengage Learning
expand_more
expand_more
format_list_bulleted
Videos
Textbook Question
Chapter 1.2, Problem 8E
An article in Archaeometry presented an analysis of 26 samples of Romano–British pottery, found at four different kiln sites in the United Kingdom. The percentage of aluminum oxide in each of the 26 samples is given below:
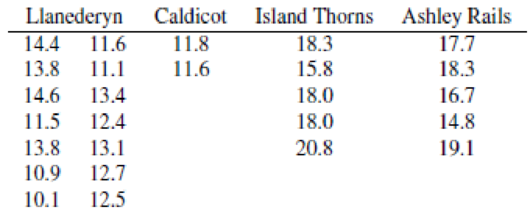
Source: A. Tubb, A. J. Parker, and G. Nickless, “The Analysis of Romano–British Pottery by Atomic Absorption Spectrophotometry,” Archaeometry 22 (1980): 153.
- a Construct a relative frequency histogram to describe the aluminum oxide content of all 26 pottery samples.
- b What unusual feature do you see in this histogram? Looking at the data, can you think of an explanation for this unusual feature?
Expert Solution & Answer
Want to see the full answer?
Check out a sample textbook solution
Students have asked these similar questions
Following are measurements of soil concentrations (in mg /kg) of chromium (Cr) and nickel (Ni) at20 sites in the area of Cleveland, Ohio. These data are taken from the article "Variation in NorthAmerican Regulatory Guidance for Heavy Metal Surface Soil Contamination at Commercial andIndustrial Sites" (A. Jennings and J. Ma, J. Environment Eng, 2007:587-609).
Cr: 260 19 36 247 263 319 317 277 319 264 23 29 61 119 33 281 21 35 64 30Ni: 435 377 359 53 38 38 54 188 397 33 92 490 28 35 799 347 321 32 74 508
(a) Construct a histogram for each set of concentrations.
(b) Find the 1st, 2nd and 3rd quartiles for the Cr concentrations
(c) Find the 1st, 2nd and 3rd quartiles for the Ni concentrations.
In a study conducted in Italy, 10 patients with hypertriglyceridemia were placed on a low-fat, high-carbohydrate diet. Before the start of the diet, cholesterol and triglyceride measurements were recorded for each subject. Patient Cholesterol Level (mmol/l) Triglyceride level (mmol/l) 1 5.12 2.30 2 6.18 2.54 3 6.77 2.95 4 6.65 3.77 5 6.36 4.18 6 5.90 5.31 7 5.48 5.53 8 6.02 8.83 9 10.34 9.48 10 8.51 14.20A. Use STATA to Calculate the Spearman rank correlation coefficient, rs, for these data. B. Using rs, test the null hypothesis that the population correlation, ρ, equals 0.
The article “Hydrogeochemical Characteristics of Groundwater in a Mid-Western CoastalAquifer System” (S. Jeen, J. Kim, et al., Geosciences Journal, 2001:339–348) presentsmeasurements of various properties of shallow groundwater in a certain aquifer system inKorea. Following are measurements of electrical conductivity (in microsiemens percentimeter) for 23 water samples.2099 528 2030 1350 1018 384 14991265 375 424 789 810 522 513488 200 215 486 257 557 260461 500Find the mean.Find the standard deviation.Find the median.Construct a dotplot.Find the 10% trimmed mean.Find the first quartile.Find the third quartile.Find the interquartile range.Construct a boxplot.Which of the points, if any, are outliers?If a histogram were constructed, would it be skewed to the left, skewed to the right, orapproximately symmetric?
Chapter 1 Solutions
Mathematical Statistics with Applications
Ch. 1.1 - For each of the following situations, identify the...Ch. 1.2 - Are some cities more windy than others? Does...Ch. 1.2 - Of great importance to residents of central...Ch. 1.2 - The top 40 stocks on the over-the-counter (OTC)...Ch. 1.2 - Given here is the relative frequency histogram...Ch. 1.2 - The relative frequency histogram given next was...Ch. 1.2 - The self-reported heights of 105 students in a...Ch. 1.2 - An article in Archaeometry presented an analysis...Ch. 1.3 - Resting breathing rates for college-age students...Ch. 1.3 - It has been projected that the average and...
Ch. 1.3 - The following results on summations will help us...Ch. 1.3 - Prob. 12ECh. 1.3 - Prob. 13ECh. 1.3 - Refer to Exercise 1.3 and repeat parts (a) and (b)...Ch. 1.3 - Refer to Exercise 1.4 and repeat parts (a) and (b)...Ch. 1.3 - Prob. 16ECh. 1.3 - Prob. 17ECh. 1.3 - Prob. 18ECh. 1.3 - Prob. 19ECh. 1.3 - Prob. 20ECh. 1.3 - The manufacturer of a new food additive for beef...Ch. 1 - Prove that the sum of the deviations of a set of...Ch. 1 - The mean duration of television commercials is 75...Ch. 1 - Aqua running has been suggested as a method of...Ch. 1 - The following data give the lengths of time to...Ch. 1 - Prob. 26SECh. 1 - Prob. 27SECh. 1 - The discharge of suspended solids from a phosphate...Ch. 1 - Prob. 29SECh. 1 - Compared to their stay-at-home peers, women...Ch. 1 - Prob. 31SECh. 1 - Prob. 32SECh. 1 - Prob. 33SECh. 1 - Prob. 34SECh. 1 - Prob. 35SECh. 1 - Prob. 36SECh. 1 - Prob. 37SECh. 1 - Prob. 38SE
Knowledge Booster


Learn more about
Need a deep-dive on the concept behind this application? Look no further. Learn more about this topic, statistics and related others by exploring similar questions and additional content below.Similar questions
- Urban Travel Times Population of cities and driving times are related, as shown in the accompanying table, which shows the 1960 population N, in thousands, for several cities, together with the average time T, in minutes, sent by residents driving to work. City Population N Driving time T Los Angeles 6489 16.8 Pittsburgh 1804 12.6 Washington 1808 14.3 Hutchinson 38 6.1 Nashville 347 10.8 Tallahassee 48 7.3 An analysis of these data, along with data from 17 other cities in the United States and Canada, led to a power model of average driving time as a function of population. a Construct a power model of driving time in minutes as a function of population measured in thousands b Is average driving time in Pittsburgh more or less than would be expected from its population? c If you wish to move to a smaller city to reduce your average driving time to work by 25, how much smaller should the city be?arrow_forwardIn a study, 10 healthy men were exposed to diesel exhaust for 1 hour. A measure of brain activity (called median power frequency, or MPF in Hz) was recorded at two different locations in the brain both before and after the diesel exhaust exposure. The resulting data are given in the accompanying table. For purposes of this exercise, assume that the sample of 10 men is representative of healthy adult males. Subject MPF (in Hz) Location 1before Location 1after Location 2before Location 2after 1 6.4 8.0 6.9 9.4 2 8.6 12.7 9.5 11.2 3 7.4 8.4 6.6 10.2 4 8.6 9.0 9.0 9.7 5 9.8 8.4 9.6 9.2 6 8.9 11.0 9.0 11.9 7 9.1 14.4 7.9 9.3 8 7.4 11.1 8.1 9.1 9 6.7 7.3 7.2 8.0 10 8.9 11.2 7.4 9.3 Construct a 90% confidence interval estimate for the difference in mean MPF at brain location 1 (in Hz) before and after exposure to diesel exhaust. (Hint: See Example 13.7.) (Use ?d = ?before − ?after. Use a table or technology. Round your answers to two decimal places.)…arrow_forwardThe article “An Automatic Visual System for Marble Tile Classification” (L. Carrino, W. Polini, and S. Turchetta, Journal of Engineering Manufacture, 2002:1095–1108) describes a measure for the shade of marble tile in which the amount of light reflected by the tile is measured on a scale of 0–255. A perfectly black tile would reflect no light and measure 0, and a perfectly white tile would measure 255. A sample of nine Mezza Perla tiles were measured, with the following results: 204.999206.149202.102207.048203.496 206.343203.496206.676205.831 Is it appropriate to use the Student's t statistic to construct a 95% confidence interval for the mean shade of Mezza Perla tile? If so, construct the confidence interval. If not, explain why not.arrow_forward
- Three samples of each of three types of PVC pipe of equal wall thickness are tested to failure under three temperature conditions, yielding the results shown below. Research questions: Is mean burst strength affected by temperature and/or by pipe type? Is there a “best” brand of PVC pipe? Burst Strength of PVC Pipes (psi) Temperature PVC1 PVC2 PVC3 Hot (70º C) 247 299 239 277 287 262 283 275 279 Warm (40º C) 325 341 297 322 319 315 296 335 304 Cool (10º C) 358 375 327 366 352 334 338 359 340 Click here for the Excel Data File (a-1) Choose the correct row-effect hypotheses. a. H0: A1 ≠ A2 ≠ A3 ≠ 0 ⇐⇐ Temperature means differ H1: All the Aj are equal to zero ⇐⇐ Temperature means are the same b. H0: A1 = A2 = A3 = 0 ⇐⇐ Temperature means are the same H1: Not all the Aj are equal to zero ⇐⇐ Temperature means differ a b (a-2) Choose the correct column-effect hypotheses. a. H0: B1 ≠ B2 ≠ B3 ≠ 0 ⇐⇐…arrow_forwardRecently, researchers have begun to focus on the relationship between potentially toxic environmental exposures in children to a number of adverse health outcomes. Suppose one such researcher wants to investigate the relationship between lead levels in soil (micrograms/dL) and BMI (kg/m2). The following table represents a SRS of households with the corresponding exterior lead levels and BMI of a randomly sampled child in the home. Lead levels BMI 13.6 19.7 14.3 19.9 9.7 20.1 9.4 22.1 11.4 19.8 10.9 21.6 A) Write out the null and alternative hypotheses for a formal test of significance testing the correlation between the two variables and calulate a t statistic and interpret your pvalue and results.arrow_forwardAn automotive engineer is investigating two different types of metering devices for an electronic fuel injection system to determine whether they differ in their fuel mileage performance. The system is installed on 10 different cars, and a test is run with each metering device on each car. The data is provided below: Metering Device Car 1 2 1 17.6 16.8 2 19.4 20.0 3 18.2 17.6 4 17.1 16.4 5 15.3 16.0 6 15.9 15.9 7 16.3 16.5 8 18.0 18.4 9 17.3 16.4 10 19.1 20.1 Is there a significant difference between the means of the two metering devices? Use . Interpret the result in the context of the problem. An article in the journal Hazardous Waste and Hazardous Materials (Vol. 6, 1989) reported the results of an analysis of the weight of calcium in standard cement and cement doped with lead. Reduced levels of calcium would indicate that the hydration mechanism in the cement is blocked…arrow_forward
arrow_back_ios
arrow_forward_ios
Recommended textbooks for you
 Functions and Change: A Modeling Approach to Coll...AlgebraISBN:9781337111348Author:Bruce Crauder, Benny Evans, Alan NoellPublisher:Cengage Learning
Functions and Change: A Modeling Approach to Coll...
Algebra
ISBN:9781337111348
Author:Bruce Crauder, Benny Evans, Alan Noell
Publisher:Cengage Learning
Hypothesis Testing using Confidence Interval Approach; Author: BUM2413 Applied Statistics UMP;https://www.youtube.com/watch?v=Hq1l3e9pLyY;License: Standard YouTube License, CC-BY
Hypothesis Testing - Difference of Two Means - Student's -Distribution & Normal Distribution; Author: The Organic Chemistry Tutor;https://www.youtube.com/watch?v=UcZwyzwWU7o;License: Standard Youtube License