
Mathematical Statistics with Applications
7th Edition
ISBN: 9780495110811
Author: Dennis Wackerly, William Mendenhall, Richard L. Scheaffer
Publisher: Cengage Learning
expand_more
expand_more
format_list_bulleted
Videos
Textbook Question
Chapter 1.3, Problem 15E
Refer to Exercise 1.4 and repeat parts (a) and (b) of Exercise 1.13.
1.13 Refer to Exercise 1.2.
- a Calculate
- b Calculate the interval
empirical rule .
1.4 The top 40 stocks on the over-the-counter (OTC) market, ranked by percentage of outstanding shares traded on one day last year are as follows:
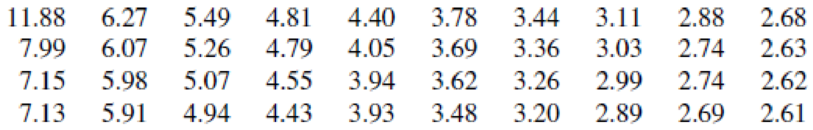
- a Construct a relative frequency histogram to describe these data.
- b What proportion of these top 40 stocks traded more than 4% of the outstanding shares?
- c If one of the stocks is selected at random from the 40 for which the preceding data were taken, what is the probability that it will have traded fewer than 5% of its outstanding shares?
Expert Solution & Answer
Want to see the full answer?
Check out a sample textbook solution
Students have asked these similar questions
If the value of Cronbach’s alpha is 0.07, it means ___________;
a.
Research instrument is not reliable
b.
Research instrument is internally consistent
c.
Data is reliable
d.
Data is internally consistent
Consider the following regression equation specied for 2-period panel data:
where i = 1; 2; :::N and t = 1; 2. If you expect that β_1 is positive, but the correlation between Δx_i and Δu_i is negative, thenwhat is the bias in the OLS estimator of β_1 in the first-differenced equation?
You are conducting quality control for a company that manufactures LED displays. The factory you are assessing is supposed to have a manufacturing defect rate of 1 in 100 LED displays.
As part of your assessment, you want to verify this defect rate by analyzing a random sample of LED displays. You are planning to randomly sample 1500 displays from this factory and observe how many of them contain manufacturing defects. Let Zi be equal to 1 if the i’th display has a defect and 0 otherwise, for i = 1,...,1500.
(a) What is the statistic that you will use to estimate the defect rate for this factory? How do you compute it using Z1, Z2, . . . , Z1500?
(b) Assuming that the true defect rate for this factory is in fact 1 in 100 displays, can we approximate the sampling distribution of the statistic that you selected in part (a) using a normal distribution? Please state and check the requirements for applying the approximation, and identify the mean and standard deviation of the normal…
Chapter 1 Solutions
Mathematical Statistics with Applications
Ch. 1.1 - For each of the following situations, identify the...Ch. 1.2 - Are some cities more windy than others? Does...Ch. 1.2 - Of great importance to residents of central...Ch. 1.2 - The top 40 stocks on the over-the-counter (OTC)...Ch. 1.2 - Given here is the relative frequency histogram...Ch. 1.2 - The relative frequency histogram given next was...Ch. 1.2 - The self-reported heights of 105 students in a...Ch. 1.2 - An article in Archaeometry presented an analysis...Ch. 1.3 - Resting breathing rates for college-age students...Ch. 1.3 - It has been projected that the average and...
Ch. 1.3 - The following results on summations will help us...Ch. 1.3 - Prob. 12ECh. 1.3 - Prob. 13ECh. 1.3 - Refer to Exercise 1.3 and repeat parts (a) and (b)...Ch. 1.3 - Refer to Exercise 1.4 and repeat parts (a) and (b)...Ch. 1.3 - Prob. 16ECh. 1.3 - Prob. 17ECh. 1.3 - Prob. 18ECh. 1.3 - Prob. 19ECh. 1.3 - Prob. 20ECh. 1.3 - The manufacturer of a new food additive for beef...Ch. 1 - Prove that the sum of the deviations of a set of...Ch. 1 - The mean duration of television commercials is 75...Ch. 1 - Aqua running has been suggested as a method of...Ch. 1 - The following data give the lengths of time to...Ch. 1 - Prob. 26SECh. 1 - Prob. 27SECh. 1 - The discharge of suspended solids from a phosphate...Ch. 1 - Prob. 29SECh. 1 - Compared to their stay-at-home peers, women...Ch. 1 - Prob. 31SECh. 1 - Prob. 32SECh. 1 - Prob. 33SECh. 1 - Prob. 34SECh. 1 - Prob. 35SECh. 1 - Prob. 36SECh. 1 - Prob. 37SECh. 1 - Prob. 38SE
Knowledge Booster


Learn more about
Need a deep-dive on the concept behind this application? Look no further. Learn more about this topic, statistics and related others by exploring similar questions and additional content below.Similar questions
- A)I will test the claim that there is no correlation (start with the Claim and finish with the conclusion) The best estimate The P value is (big/small) so I have to (either give the average of the y's or plug in the x into the y-=mx+b)arrow_forwardX” denote the number of children ever born to a woman, and let “Y” denote years ofeducation for the woman. A simple model relating fertility to years of education is X = β0 + β1Y + u where u is the unobserved error. (i) What kind of factors are contained in u? Are these likely to be correlated with level of education?arrow_forwardFor each of the following situations, identify whether the appropriate test is a paired t-test (for parameter µd) or a two-sample t-test (for parameter µ1 - µ2). Briefly explain your answer. Sixty students were matched by initial pulse rate, with the two with the highest pulse forming a pair, and so on. Within each pair, one student was randomly chosen to drink a caffeinated beverage, while the other one drank an equivalent amount of water. Their pulse rates were measured 10 minutes later, to test whether caffeine consumption elevates pulse rates. To determine whether lack of sleep increases appetite, researchers recruited 50 volunteers and randomly assigned 25 of them to sleep at least 8 hours a night and the other 25 to sleep at most 5 hours a night, for 3 days. Calorie intake was recorded for all 50 volunteers for the 3-day period.arrow_forward
- The article in the ASCE Journal of Energy Engineering (1999, Vol. 125, pp.59-75) describes a study of the thermal inertia properties of autoclaved aerated concrete used as a building material. Five samples of the material were tested in a structure, and the average interior temperatures (°C) reported were as follows: 23.01, 22.22, 22.04, 22.62, and 22.59. Test that the average interior temperature is equal to 22.5°C using alpha (a) = 0.05. This problem is a test on what population parameter? What is the null and alternative hypothesis? What are the Significance level and type of test? What standardized test statistic will be used? What is the standard test statistic? What is the Statistical Decision? What is the statistical decision in the statement form?arrow_forwardA scientist studying local lakes claims that there is a linear relationship between a lake’s level of mercury and the lake’s depth. The scientist collected data to test the claim at a significance level of α=0.01. The following hypotheses were tested. H0:β1=0Ha:β1≠0 The test yielded a t-value of 2.7 and a p-value of 0.012. Which of the following is a correct conclusion about the scientist’s claim? The null hypothesis is rejected since 0.012>0.01. There is sufficient evidence to suggest that there is a linear relationship between a lake’s level of mercury and the lake’s depth. A The null hypothesis is not rejected since 0.012>0.01. There is sufficient evidence to suggest that there is a linear relationship between a lake’s level of mercury and the lake’s depth. B The null hypothesis is rejected since 0.012>0.01. There is not sufficient evidence to suggest that there is a linear relationship between a lake’s level of mercury and the lake’s depth.…arrow_forwardAssume that as a portfolio manager the beta of your portfolio is 1.15 and that your performance is exactly on target with the SML data under condition 1. If the true SML data is given by condition 2, how much does your performance differ from the true SML? (1) RFR = 0.0625 Rm(proxy) = 0.12 (2) RK = 0.078 Rm(true) = 0.10arrow_forward
- Suppose μ1 and μ2 are true mean stopping distances at 50 mph for cars of a certain type equipped with two different types of braking systems. The data follows: m = 8, x = 114.6, s1 = 5.03, n = 8, y = 129.3, and s2 = 5.38. Calculate a 95% CI for the difference between true average stopping distances for cars equipped with system 1 and cars equipped with system 2. (Round your answers to two decimal places.) ,arrow_forwardSuppose now that that Y denotes the annual salaries (in thousands of dollars) for US citizenswho are in their 40s and 50; and X is an indicator (dummy) variable: X = 1 if that workergraduated from college and X=0 otherwise. Suppose the average annual salary for this age groupis $45,000 and the estimate for β is β~ = 15 with s.e. = 5.a. What is the t-statistic and associated p-value for the null hypothesis that attending collegehas no impact on subsequent salary?b. What is the upper and lower bound of a 95-percent confidence interval for β~ ?c. In a credible research design attending college would be randomly assigned to a largesample of potential students. Propose such a research design. What are the potential ethicalissues?arrow_forwardA dietitian wishes to see if a person’s cholesterol level will be changed if the diet is supplemented by a certain mineral. Four subjects were pre-tested, and they took the mineral supplement for a 6-week period. The results are shown in the table. Is there sufficient evidence to conclude that the population mean of cholesterol levels has been changed after six weeks at α=0.2α=0.2? Assume that the differences are from an approximately normally distributed population. Subject Cholestrol Level (mg/dl) Cholestrol Level after 6 Weeks (mg/dl) dd ¯dd¯ (d−¯d)2(d-d¯)2 1 206 217 11 2 219 184 -35 3 202 204 2 4 213 205 -8 Total -30 a) Calculate the mean, the sum of the squared deviation from the mean, and the standard deviation of differences. Do not include the unit for each answer: ¯d=d¯= (do not round) ∑(d−¯d)2=∑(d-d¯)2= (do not round) sd=sd= (rounded to one decimal place) b) Perform the hypothesis test in the following steps: Step 1.…arrow_forward
- A major credit card company is interested in whether there is a linear relationship between its internal rating of a customer’s credit risk and that of an independent rating agency. The company collected a random sample of 200 customers and used the data to test the claim that there is a linear relationship. The following hypotheses were used to test the claim. H0:β1=0Ha:β1≠0 The test yielded a t-value of 3.34 with a corresponding p-value of 0.001. Which of the following is the correct interpretation of the p-value? If the alternative hypothesis is true, the probability of observing a test statistic at least as extreme as 3.34 is 0.001. If the alternative hypothesis is true, the probability of observing a test statistic at least as extreme as 3.34 is 0.001. A If the alternative hypothesis is true, the probability of observing a test statistic of 3.34 or greater is 0.001. If the alternative hypothesis is true, the probability of observing a test statistic of 3.34 or greater…arrow_forwardA sample of men and women who had passed their driver's test either the first time or the second time were surveyed, with the following results: Results of the driving test Gender First time Second time Men 126 211 Women 135 178 a) Do these data suggest that there is a relationship between gender and the passing of their driver’s test from which the present sample was drawn? Let alpha=.05 b) Interpret your results c) Write a brief report of your findingsarrow_forwardSee the attached image for the introduction. In terms of variables xi and parameters βi, write the null and alternative hypotheses for testing whether, after including Price/Square Feet(x2) in the model already, the further incorporation of the other 2 explanatory variables (x1, x3) adds any useful information for explaining pricey. Also, give the value of the F statistic and its degrees of freedom (df).arrow_forward
arrow_back_ios
SEE MORE QUESTIONS
arrow_forward_ios
Recommended textbooks for you
 Glencoe Algebra 1, Student Edition, 9780079039897...AlgebraISBN:9780079039897Author:CarterPublisher:McGraw Hill
Glencoe Algebra 1, Student Edition, 9780079039897...
Algebra
ISBN:9780079039897
Author:Carter
Publisher:McGraw Hill
What Are Research Ethics?; Author: HighSchoolScience101;https://www.youtube.com/watch?v=nX4c3V23DZI;License: Standard YouTube License, CC-BY
What is Ethics in Research - ethics in research (research ethics); Author: Chee-Onn Leong;https://www.youtube.com/watch?v=W8Vk0sXtMGU;License: Standard YouTube License, CC-BY