
Mathematical Ideas with Integrated Review and Worksheets plus NEW MyLab Math with Pearson eText -- Access Card Package (Integrated Review Courses in MyLab Math and MyLab Statistics)
1st Edition
ISBN: 9780321977274
Author: Miller, Charles, Heeren, Vern, HORNSBY, John, Christopher
Publisher: PEARSON
expand_more
expand_more
format_list_bulleted
Videos
Textbook Question
Chapter 12.1, Problem 13E
Federal Revenue and Spending The graph shows U.S. government receipts and outlays (both on-budget and off-budget) for 2001-2012. Refer to the graph for Exercises 11-15.
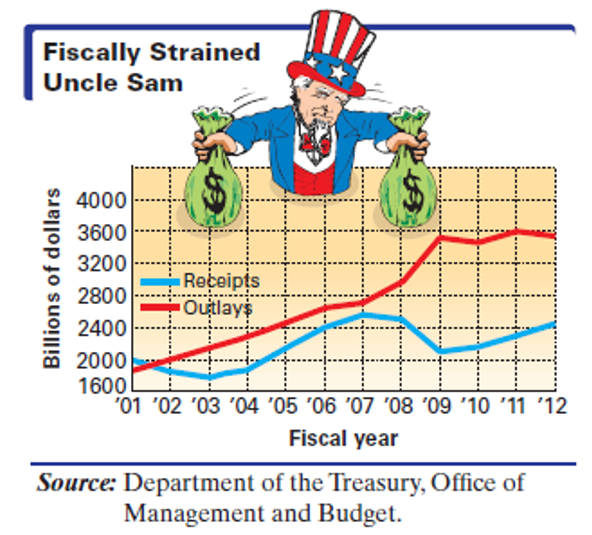
In what years did receipts appear to climb faster than outlays?
Expert Solution & Answer
Want to see the full answer?
Check out a sample textbook solution
Students have asked these similar questions
Part b?
Which scenario BEST describes the graph below?
As the weight of a package increased, the
shipping cost increased proportionally.
A race car driver accelerated quickly, stopped,
accelerated again, and then stopped quickly.
A vacuum salesperson sold a constant number
of vacuums and then experienced a steady
increase in the n umber of vacuums sold.
A puppy gained weight quickly, still gained
weight but not as quickly, and then stayed at a
constant weight.
A.
B.
C.
The graph shows government receipts
and outlays (both on-budget
and off-budget) for 1991-2001. In what
years did receipts appear to climb faster
than outlays?
Choose the correct answer below.
OA. 1995, 1996, 1997 and 2001
OB. 1992, 1994, 1998 and 1999
O C. 1991, 1992, 1993 and 1994
D. 1991, 1998, 1999 and 2000
Billions of Dollars
4,400
4,000
3,600
3,200
2,800
2,400
2,000
Receipts
Outlays
1991 92 93 94 95 96 97
Fiscal Years
'98
'99 '00 '01
...
Chapter 12 Solutions
Mathematical Ideas with Integrated Review and Worksheets plus NEW MyLab Math with Pearson eText -- Access Card Package (Integrated Review Courses in MyLab Math and MyLab Statistics)
Ch. 12.1 - In Exercises I and 2, use the given data to do the...Ch. 12.1 - In Exercises 1 and 2, use the given data to do the...Ch. 12.1 - In Exercises 3-6, use the given data to do the...Ch. 12.1 - In Exercises 3-6, use the given data to do the...Ch. 12.1 - In Exercises 3-6, use the given data to do the...Ch. 12.1 - In Exercises 3-6, use the given data to do the...Ch. 12.1 - In each of Exercises 7-10, construct a...Ch. 12.1 - In each of Exercises 7-10, construct a...Ch. 12.1 - In each of Exercises 7-10, construct a...Ch. 12.1 - In each of Exercises 7-10, construct a...
Ch. 12.1 - Federal Revenue and Spending The graph shows U.S....Ch. 12.1 - Federal Revenue and Spending The graph shows U.S....Ch. 12.1 - Federal Revenue and Spending The graph shows U.S....Ch. 12.1 - Federal Revenue and Spending The graph shows U.S....Ch. 12.1 - Prob. 15ECh. 12.1 - Refer to the above graphs for Exercises 16-20....Ch. 12.1 - Prob. 17ECh. 12.1 - Refer to the above graphs for Exercises 16-20....Ch. 12.1 - Prob. 19ECh. 12.1 - Refer to the above graphs for Exercises 16-20....Ch. 12.1 - Reading a Circle Graph of Job-Training Sources The...Ch. 12.1 - Reading a Circle Graph of Job-Training Sources The...Ch. 12.1 - Prob. 23ECh. 12.1 - Correspondence between Education and Earnings Data...Ch. 12.1 - Prob. 25ECh. 12.1 - Net Worth of Retirement Savings Saura, wishing to...Ch. 12.1 - Prob. 27ECh. 12.1 - Net Worth of Retirement Savings Saura, wishing to...Ch. 12.1 - Prob. 29ECh. 12.1 - Sample Masses in a Geology Laboratory...Ch. 12.1 - Sample Masses in a Geology Laboratory...Ch. 12.1 - Record Temperatures According to the National...Ch. 12.1 - Prob. 33ECh. 12.1 - Frequencies and Probabilities of letter Occurrence...Ch. 12.1 - Prob. 35ECh. 12.1 - Prob. 36ECh. 12.1 - 37. Is the probability distribution in Exercise 36...Ch. 12.1 - Prob. 38ECh. 12.1 - Probabilities of Study Times Recall that the...Ch. 12.1 - Favorite Sports among Recreation Students The 40...Ch. 12.1 - Favorite Sports among Recreation Students The 40...Ch. 12.1 - Favorite Sports among Recreation Students The 40...Ch. 12.2 - For each list of data, calculate (a) the mean (to...Ch. 12.2 - For each list of data, calculate (a) the mean (to...Ch. 12.2 - For each list of data, calculate (a), the mean (to...Ch. 12.2 - For each list of data, calculate (a) the mean (to...Ch. 12.2 - For each list of data, calculate (a) the mean (to...Ch. 12.2 - For each list of data, calculate (a) the mean (to...Ch. 12.2 - For each list of data, calculate (a) the mean (to...Ch. 12.2 - For each list of data, calculate (a) the mean (to...Ch. 12.2 - Answer each question. Gymnasts' Scores An Olympic...Ch. 12.2 - Quiz Grades The average of 5 quiz grades is 10....Ch. 12.2 - For each category in Exercises 11-16, find (a) (he...Ch. 12.2 - For each category in Exercises 11-16, find (a) the...Ch. 12.2 - For each category in Exercises 11-16, find (a) the...Ch. 12.2 - For each category in Exercises 11-16, find (a) the...Ch. 12.2 - For each category in Exercises 11-16, find (a) the...Ch. 12.2 - For each category in Exercises 11-16, find (a) the...Ch. 12.2 - Leading U.S. Businesses The table shows the top...Ch. 12.2 - Leading U.S. Businesses The table shows the top...Ch. 12.2 - Measuring Elapsed Times While doing an experiment,...Ch. 12.2 - Measuring Elapsed Times White doing an experiment,...Ch. 12.2 - The student from Exercises 19 and 20,when...Ch. 12.2 - The student from Exercises 19 and 20,when...Ch. 12.2 - The student from Exercises 19 and 20,when...Ch. 12.2 - The student from Exercises 19 and 20, when...Ch. 12.2 - Scores on Management Examinations Thao earned the...Ch. 12.2 - Scores on Management Examinations Thao earned the...Ch. 12.2 - Scores on Management Examinations Thao earned the...Ch. 12.2 - For each of the following frequency distributions,...Ch. 12.2 - Prob. 29ECh. 12.2 - 30. Average Employee Salary A company has
15...Ch. 12.2 - Grade-Point Averages Find the grade-point average...Ch. 12.2 - Grade-Point Averages Find the grade-point average...Ch. 12.2 - Prob. 33ECh. 12.2 - Federal Budget Totals The table gives federal...Ch. 12.2 - Prob. 35ECh. 12.2 - World Cell Phone Use In 2012, just the top six...Ch. 12.2 - Prob. 37ECh. 12.2 - Crew, Passengers, and Hijackers on 3/11 Airliners...Ch. 12.2 - Prob. 39ECh. 12.2 - Olympic Medal Standings The top ten medal-winning...Ch. 12.2 - Prob. 41ECh. 12.2 - Olympic Medal Standings The top ten medal-winning...Ch. 12.2 - Prob. 43ECh. 12.2 - In Exercises 44 and 45, use the given...Ch. 12.2 - Prob. 45ECh. 12.2 - What does your box plot of Exercise 18 for...Ch. 12.2 - Prob. 47ECh. 12.2 - Prob. 48ECh. 12.2 - Prob. 49ECh. 12.2 - Prob. 50ECh. 12.2 - Prob. 51ECh. 12.2 - Prob. 52ECh. 12.2 - Prob. 53ECh. 12.2 - Prob. 54ECh. 12.2 - Prob. 55ECh. 12.2 - Prob. 56ECh. 12.2 - Prob. 57ECh. 12.2 - Prob. 58ECh. 12.2 - For Exercises 57-59, refer to the grouped...Ch. 12.2 - Prob. 60ECh. 12.3 - 1. If your calculator finds both the sample...Ch. 12.3 - 2. If your calculator finds only one kind of...Ch. 12.3 - Find (a) the range, and (b) the standard deviation...Ch. 12.3 - Find (a) the range, and (b) the standard deviation...Ch. 12.3 - Find (a) the range, and (b) the standard deviation...Ch. 12.3 - Find (a) the range, and (b) the standard deviation...Ch. 12.3 - Find (a) the range, and (b) the standard deviation...Ch. 12.3 - Find (a) the range, and (b) the standard deviation...Ch. 12.3 - Find (a) the range, and (b) the standard deviation...Ch. 12.3 - Find (a) the range, and (b) the standard deviation...Ch. 12.3 - Use Chebyshev’s theorem for Exercises 11-22. Give...Ch. 12.3 - Use Chebyshev's theorem for Exercises 11-22. Give...Ch. 12.3 - Use Chebyshev's theorem for Exercises 11-22. Give...Ch. 12.3 - Use Chebyshev's theorem for Exercises 11-22. Give...Ch. 12.3 - Prob. 15ECh. 12.3 - Use Chebyshev's theorem for Exercises 11-22. Give...Ch. 12.3 - Prob. 17ECh. 12.3 - Use Chebyshev's theorem for Exercises 11-22. Give...Ch. 12.3 - Use Chebyshev's theorem for Exercises 11-22. Give...Ch. 12.3 - Use Chebyshev's theorem for Exercises 11-22. Give...Ch. 12.3 - Prob. 21ECh. 12.3 - Use Chebyshev's theorem for Exercises 11-22. Give...Ch. 12.3 - Prob. 23ECh. 12.3 - Travel Accommodation CostsGabriel and Lucia took a...Ch. 12.3 - Travel Accommodation Costs Gabriel and Lucia took...Ch. 12.3 - Travel Accommodation Costs Gabriel and Lucia took...Ch. 12.3 - Travel Accommodation Costs Gabriel and Lucia took...Ch. 12.3 - Travel Accommodation Costs Gabriel and Lucia took...Ch. 12.3 - In Exercises 29 and 30, two samples are given. In...Ch. 12.3 - In Exercises 29 and 30, two samples are given. In...Ch. 12.3 - Utilize the following sample for Exercises...Ch. 12.3 - Utilize the following sample for Exercises 31-36....Ch. 12.3 - Prob. 33ECh. 12.3 - Utilize the following sample for Exercises...Ch. 12.3 - Prob. 35ECh. 12.3 - Utilize the following sample for Exercises...Ch. 12.3 - 37. Comparing Water Heater Lifetimes Two brands of...Ch. 12.3 - Lifetimes of Engine Control Modules Chin manages...Ch. 12.3 - Lifetimes of Engine Control Modules Chin manages...Ch. 12.3 - Prob. 40ECh. 12.3 - 41. In Section 12.2 we showed that the mean, as a...Ch. 12.3 - Prob. 42ECh. 12.3 - A Cereal-Marketing Survey A food distribution...Ch. 12.3 - A Cereal-Marketing Survey A food distribution...Ch. 12.3 - A Cereal-Marketing Survey A food distribution...Ch. 12.3 - Prob. 46ECh. 12.3 - Prob. 47ECh. 12.3 - Prob. 48ECh. 12.3 - Prob. 49ECh. 12.3 - Prob. 50ECh. 12.3 - Prob. 51ECh. 12.3 - Prob. 52ECh. 12.4 - Numbers of Restaurant Customers Refer to the...Ch. 12.4 - Numbers of Restaurant Customers Refer to the...Ch. 12.4 - Numbers of Restaurant Customers Refer to the...Ch. 12.4 - Numbers of Restaurant Customers Refer to the...Ch. 12.4 - In Exercises 5-8, make use of z-scores.
5....Ch. 12.4 - In Exercises 5-8, make use of z-scores.
6....Ch. 12.4 - In Exercises 5-8, make use of z-scores.
7....Ch. 12.4 - In Exercises 5-8, make use of z-scores. Relative...Ch. 12.4 - World's Largest Energy Producers and Consumers The...Ch. 12.4 - World's Largest Energy Producers and Consumers The...Ch. 12.4 - World's Largest Energy Producers and Consumers The...Ch. 12.4 - World's Largest Energy Producers and Consumers The...Ch. 12.4 - World's Largest Energy Producers and Consumers The...Ch. 12.4 - World's Largest Energy Producers and ConsumersThe...Ch. 12.4 - World's Largest Energy Producers and Consumers The...Ch. 12.4 - World's Largest Energy Producers and Consumers The...Ch. 12.4 - Determine which was relatively higher: Canada in...Ch. 12.4 - Construct box plots for both production and...Ch. 12.4 - Prob. 19ECh. 12.4 - 20. Comparing your two box plots of Exercise 18,...Ch. 12.4 - The text stated that for any distribution of data,...Ch. 12.4 - 22. Describe the basic difference between a...Ch. 12.4 - Prob. 23ECh. 12.4 - This chapter has introduced three major...Ch. 12.4 - Prob. 25ECh. 12.4 - Prob. 26ECh. 12.4 - Prob. 27ECh. 12.4 - Prob. 28ECh. 12.4 - Prob. 29ECh. 12.4 - Prob. 30ECh. 12.4 - Prob. 31ECh. 12.4 - Prob. 32ECh. 12.4 - In Exercises 32-35, answer yes or no and explain...Ch. 12.4 - In Exercises 32-35, answer yes or no and explain...Ch. 12.4 - In Exercises 32-35, answer yes or no and explain...Ch. 12.4 - Prob. 36ECh. 12.4 - Prob. 37ECh. 12.4 - Prob. 38ECh. 12.4 - Prob. 39ECh. 12.4 - Prob. 40ECh. 12.4 - Prob. 41ECh. 12.4 - Prob. 42ECh. 12.4 - Prob. 43ECh. 12.4 - Prob. 44ECh. 12.4 - Prob. 45ECh. 12.4 - Prob. 46ECh. 12.4 - Prob. 47ECh. 12.4 - Prob. 48ECh. 12.4 - Prob. 49ECh. 12.4 - Prob. 50ECh. 12.4 - Prob. 51ECh. 12.4 - Prob. 52ECh. 12.4 - Prob. 53ECh. 12.4 - Prob. 54ECh. 12.5 - Identify each variable quantity as discrete or...Ch. 12.5 - Identify each variable quantity as discrete or...Ch. 12.5 - Identify each variable quantity as discrete or...Ch. 12.5 - Prob. 4ECh. 12.5 - Identify each variable quantity as discrete or...Ch. 12.5 - Prob. 6ECh. 12.5 - Measuring the Mass of Ore Samples Suppose 100...Ch. 12.5 - Measuring the Mass of Ore Samples Suppose 100...Ch. 12.5 - Measuring the Mass of Ore Samples Suppose 100...Ch. 12.5 - Measuring the Mass of Ore Samples Suppose 100...Ch. 12.5 - Distribution of IQ Scores On standard IQ tests,...Ch. 12.5 - Distribution of IQ Scores On standard IQ tests,...Ch. 12.5 - Distribution of IQ Scores On standard IQ tests,...Ch. 12.5 - Distribution of IQ Scores On standard IQ tests,...Ch. 12.5 - Find the percentage of area under a normal curve...Ch. 12.5 - Find the percentage of area under a normal curve...Ch. 12.5 - Find the percentage of area under a normal curve...Ch. 12.5 - Find the percentage of area under a normal curve...Ch. 12.5 - Find the percentage of the total area under a...Ch. 12.5 - Find the percentage of the total area under a...Ch. 12.5 - Find the percentage of the total area under a...Ch. 12.5 - Find the percentage of the total area under a...Ch. 12.5 - Find a value of z such that each condition is met....Ch. 12.5 - Find a value of z such that each condition is met....Ch. 12.5 - Find a value of z such that each condition
25....Ch. 12.5 - Find a value of z such that each condition is...Ch. 12.5 - Weights of Peaches A fruit-packing company...Ch. 12.5 - Weights of Peaches A fruit-packing company...Ch. 12.5 - Weights of Peaches A fruit-packing company...Ch. 12.5 - Weights of Peaches A fruit-packing company...Ch. 12.5 - Weights of Peaches A fruit-packing company...Ch. 12.5 - Prob. 32ECh. 12.5 - Prob. 33ECh. 12.5 - Prob. 34ECh. 12.5 - IQs of Employees A large company employs workers...Ch. 12.5 - Prob. 36ECh. 12.5 - Net Weight of Cereal Boxes A certain dry cereal is...Ch. 12.5 - Prob. 38ECh. 12.5 - Prob. 39ECh. 12.5 - Net Weight of Cereal Boxes A certain dry cereal is...Ch. 12.5 - Prob. 41ECh. 12.5 - Prob. 42ECh. 12.5 - Prob. 43ECh. 12.5 - Prob. 44ECh. 12.5 - Assume the following distributions are all normal,...Ch. 12.5 - Prob. 46ECh. 12.5 - Prob. 47ECh. 12.5 - Prob. 48ECh. 12.5 - Prob. 49ECh. 12.5 - Prob. 50ECh. 12.5 - Prob. 51ECh. 12.5 - Prob. 52ECh. 12.5 - Prob. 53ECh. 12.5 - Prob. 54ECh. 12.5 - Prob. 55ECh. 12.5 - Prob. 56ECh. 12.5 - Prob. 57ECh. 12.5 - Prob. 58ECh. 12.5 - Prob. 59ECh. 12.5 - Prob. 60ECh. 12.5 - What percentage of the items lie within 1.25...Ch. 12.5 - Prob. 62ECh. 12 - Visits to Social Networking Sites The table shows...Ch. 12 - Cheaters Never Learn The table here shows the...Ch. 12 - Use this information for Exercises 3 and 4. For...Ch. 12 - Prob. 4TCh. 12 - College Endowment AssetsThe table shows the top...Ch. 12 - College Endowment Assets The table shows the top...Ch. 12 - College Endowment Assets The table shows the top...Ch. 12 - Prob. 8TCh. 12 - Pediatrics Patients Khalida worked the 22 weekdays...Ch. 12 - Prob. 10TCh. 12 - In Exercises 11-14, find the indicated measures...Ch. 12 - In Exercises 11-14, find the indicated measures...Ch. 12 - In Exercises 11-14, find the indicated measures...Ch. 12 - Prob. 14TCh. 12 - Exam Scores in a Criminal Justice Class The...Ch. 12 - Prob. 16TCh. 12 - Use the stem-and-leaf display below for Exercises...Ch. 12 - Prob. 18TCh. 12 - Use the stem-and-leaf display below for Exercises...Ch. 12 - Use the stem-and-leaf display below for...Ch. 12 - Use the stem-and-leaf display below for...Ch. 12 - Prob. 22TCh. 12 - Triple Jump ChampionsAll Summer Olympic...Ch. 12 - Prob. 24TCh. 12 - Season Statistics in Major League Baseball The...Ch. 12 - Season Statistics in Major League Baseball The...Ch. 12 - Season Statistics in Major League Baseball The...Ch. 12 - Prob. 28TCh. 12 - Remission Data for Cocaine and Marijuana Addiction...Ch. 12 - Remission Data for Cocaine and Marijuana Addiction...
Knowledge Booster


Learn more about
Need a deep-dive on the concept behind this application? Look no further. Learn more about this topic, subject and related others by exploring similar questions and additional content below.Similar questions
- Sales Barnes & Noble had annual sales of $6.8 billion in 2013 and $6.1 billion in 2015. Use the Midpoint Formula to estimate the sales in 2014. Assume that the annual sales followed a linear pattern.arrow_forwardMathematical Models In Exercises 9 and 10, (a) plot the actual data and the model of the same graph and (b) describe how closely the model represents the data. If the model does not closely represent the data, suggest another type of model that may be a better fit. The ordered pairs below give the revenues y (in billions of dollars) for Activision Blizzard, Inc., from 2008 through 2014. 2008,3.032012,4.862009,4.282013,4.582010,4.452014,4.412011,4.76 A model for the data is y=0.184t+2.32,8t14, where t represents the year, with t=8 corresponding to 2008.arrow_forwardTable 6 shows the year and the number ofpeople unemployed in a particular city for several years. Determine whether the trend appears linear. If so, and assuming the trend continues, in what year will the number of unemployed reach 5 people?arrow_forward
- draw a line graph following this information. The line graph depicts the historical and projected sales volume of Pepsi Co Jamaica's Diet Pepsi for the next fiscal year, with the horizontal axis representing the four quarters of the year, and the vertical axis representing the sales volume in million cases. The historical sales data is represented by a line that shows a sales volume of 1 million cases for the past fiscal year. The projected sales volume is represented by another line that shows an expected increase in sales volume to 1.5 million cases for the next fiscal year. The sales targets for each quarter are represented by markers or points on the graph, with the first quarter expected to reach 0.4 million cases, the second quarter at 0.5 million cases, the third quarter at 0.3 million cases, and the fourth quarter at 0.3 million cases.arrow_forwardUse the graph below to answer the question. Cost per Gallon What was a likely result of the trend shown in the graph? Construction of highways decreased. Demand for public transportation declined. U.S. consumers bought fewer fuel efficient cars. O U.S. consumers had less money to spend on goods. Annual Gas Prices 1978-1982 3.50 3.00 2.50 2.00 1.50 1.00 0.50 0.00 T 1978 1979 1980 1981 1982 Year Source: Department of Energyarrow_forwardPlease Analysis the graph based on data.arrow_forward
- Examine attached graph. What relationship (positive, negative, none) is obsevred between economic (i) economic growth and unemployment, (i) economic growth and inflation and (iii) unemployment and inflation from the period 2009 to 2018? Justify your response. Complete the following table: Variables Relationship Justification (i) economic growth and unemployment (ii) economic growth and inflation (iii) unemployment and inflationarrow_forwardPlease choose one or more.arrow_forwardThe graph given shows how Callie spends her money each week. If Callie receives $20 allowance every two weeks, how much does she save from every allowance? $2.00 © $4.00 Callie's Budget B. $2.40 $5.00 Snacks 10% School Hobbies Lunch 12% 33% Movies 20% Savings 25%arrow_forward
arrow_back_ios
arrow_forward_ios
Recommended textbooks for you
 Big Ideas Math A Bridge To Success Algebra 1: Stu...AlgebraISBN:9781680331141Author:HOUGHTON MIFFLIN HARCOURTPublisher:Houghton Mifflin Harcourt
 Glencoe Algebra 1, Student Edition, 9780079039897...AlgebraISBN:9780079039897Author:CarterPublisher:McGraw Hill
 Trigonometry (MindTap Course List)TrigonometryISBN:9781305652224Author:Charles P. McKeague, Mark D. TurnerPublisher:Cengage Learning
Big Ideas Math A Bridge To Success Algebra 1: Stu...
Algebra
ISBN:9781680331141
Author:HOUGHTON MIFFLIN HARCOURT
Publisher:Houghton Mifflin Harcourt
Glencoe Algebra 1, Student Edition, 9780079039897...
Algebra
ISBN:9780079039897
Author:Carter
Publisher:McGraw Hill
Trigonometry (MindTap Course List)
Trigonometry
ISBN:9781305652224
Author:Charles P. McKeague, Mark D. Turner
Publisher:Cengage Learning
Graph Theory: Euler Paths and Euler Circuits; Author: Mathispower4u;https://www.youtube.com/watch?v=5M-m62qTR-s;License: Standard YouTube License, CC-BY
WALK,TRIAL,CIRCUIT,PATH,CYCLE IN GRAPH THEORY; Author: DIVVELA SRINIVASA RAO;https://www.youtube.com/watch?v=iYVltZtnAik;License: Standard YouTube License, CC-BY