
Mathematical Ideas with Integrated Review and Worksheets plus NEW MyLab Math with Pearson eText -- Access Card Package (Integrated Review Courses in MyLab Math and MyLab Statistics)
1st Edition
ISBN: 9780321977274
Author: Miller, Charles, Heeren, Vern, HORNSBY, John, Christopher
Publisher: PEARSON
expand_more
expand_more
format_list_bulleted
Videos
Question
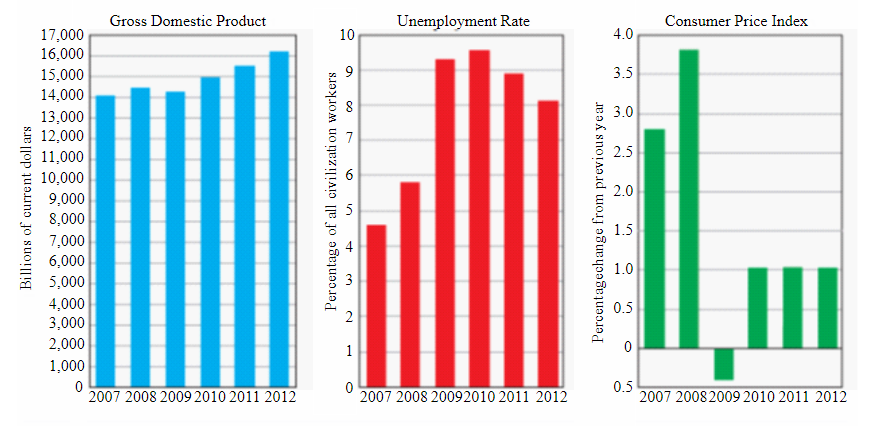
Chapter 12.1, Problem 17E
To determine
The greatest change in consumer price index over the six-year period, and the year it occurs. The graph showing trends in economic indicators.
Expert Solution & Answer
Want to see the full answer?
Check out a sample textbook solution
Students have asked these similar questions
The Following are the Index Numbers of prices (2002 = 100)
%3D
Year
Index
Year
Index
2002
100
2007
410
2003
110
2008
400
2004
120
2009
380
2005
200
2010
370
2006
400
2011
340
Shift the base from 2002 – 2008 and recast the Index Numbers.
Suppose that a firm's sales were $3,750,000 five years ago and are $5,250,000 today. What was the geometric mean growth rate in sales over the past five years?
Example 18. Calculate chain Index number with 1995 as base from the following data :
Average Whole Sale Price (in Rs.)
Commodity
1995
1996
1997
1998
1999
20
16
28
35
21
25
30
24
36
45
20
25
30
24
30
Chapter 12 Solutions
Mathematical Ideas with Integrated Review and Worksheets plus NEW MyLab Math with Pearson eText -- Access Card Package (Integrated Review Courses in MyLab Math and MyLab Statistics)
Ch. 12.1 - In Exercises I and 2, use the given data to do the...Ch. 12.1 - In Exercises 1 and 2, use the given data to do the...Ch. 12.1 - In Exercises 3-6, use the given data to do the...Ch. 12.1 - In Exercises 3-6, use the given data to do the...Ch. 12.1 - In Exercises 3-6, use the given data to do the...Ch. 12.1 - In Exercises 3-6, use the given data to do the...Ch. 12.1 - In each of Exercises 7-10, construct a...Ch. 12.1 - In each of Exercises 7-10, construct a...Ch. 12.1 - In each of Exercises 7-10, construct a...Ch. 12.1 - In each of Exercises 7-10, construct a...
Ch. 12.1 - Federal Revenue and Spending The graph shows U.S....Ch. 12.1 - Federal Revenue and Spending The graph shows U.S....Ch. 12.1 - Federal Revenue and Spending The graph shows U.S....Ch. 12.1 - Federal Revenue and Spending The graph shows U.S....Ch. 12.1 - Prob. 15ECh. 12.1 - Refer to the above graphs for Exercises 16-20....Ch. 12.1 - Prob. 17ECh. 12.1 - Refer to the above graphs for Exercises 16-20....Ch. 12.1 - Prob. 19ECh. 12.1 - Refer to the above graphs for Exercises 16-20....Ch. 12.1 - Reading a Circle Graph of Job-Training Sources The...Ch. 12.1 - Reading a Circle Graph of Job-Training Sources The...Ch. 12.1 - Prob. 23ECh. 12.1 - Correspondence between Education and Earnings Data...Ch. 12.1 - Prob. 25ECh. 12.1 - Net Worth of Retirement Savings Saura, wishing to...Ch. 12.1 - Prob. 27ECh. 12.1 - Net Worth of Retirement Savings Saura, wishing to...Ch. 12.1 - Prob. 29ECh. 12.1 - Sample Masses in a Geology Laboratory...Ch. 12.1 - Sample Masses in a Geology Laboratory...Ch. 12.1 - Record Temperatures According to the National...Ch. 12.1 - Prob. 33ECh. 12.1 - Frequencies and Probabilities of letter Occurrence...Ch. 12.1 - Prob. 35ECh. 12.1 - Prob. 36ECh. 12.1 - 37. Is the probability distribution in Exercise 36...Ch. 12.1 - Prob. 38ECh. 12.1 - Probabilities of Study Times Recall that the...Ch. 12.1 - Favorite Sports among Recreation Students The 40...Ch. 12.1 - Favorite Sports among Recreation Students The 40...Ch. 12.1 - Favorite Sports among Recreation Students The 40...Ch. 12.2 - For each list of data, calculate (a) the mean (to...Ch. 12.2 - For each list of data, calculate (a) the mean (to...Ch. 12.2 - For each list of data, calculate (a), the mean (to...Ch. 12.2 - For each list of data, calculate (a) the mean (to...Ch. 12.2 - For each list of data, calculate (a) the mean (to...Ch. 12.2 - For each list of data, calculate (a) the mean (to...Ch. 12.2 - For each list of data, calculate (a) the mean (to...Ch. 12.2 - For each list of data, calculate (a) the mean (to...Ch. 12.2 - Answer each question. Gymnasts' Scores An Olympic...Ch. 12.2 - Quiz Grades The average of 5 quiz grades is 10....Ch. 12.2 - For each category in Exercises 11-16, find (a) (he...Ch. 12.2 - For each category in Exercises 11-16, find (a) the...Ch. 12.2 - For each category in Exercises 11-16, find (a) the...Ch. 12.2 - For each category in Exercises 11-16, find (a) the...Ch. 12.2 - For each category in Exercises 11-16, find (a) the...Ch. 12.2 - For each category in Exercises 11-16, find (a) the...Ch. 12.2 - Leading U.S. Businesses The table shows the top...Ch. 12.2 - Leading U.S. Businesses The table shows the top...Ch. 12.2 - Measuring Elapsed Times While doing an experiment,...Ch. 12.2 - Measuring Elapsed Times White doing an experiment,...Ch. 12.2 - The student from Exercises 19 and 20,when...Ch. 12.2 - The student from Exercises 19 and 20,when...Ch. 12.2 - The student from Exercises 19 and 20,when...Ch. 12.2 - The student from Exercises 19 and 20, when...Ch. 12.2 - Scores on Management Examinations Thao earned the...Ch. 12.2 - Scores on Management Examinations Thao earned the...Ch. 12.2 - Scores on Management Examinations Thao earned the...Ch. 12.2 - For each of the following frequency distributions,...Ch. 12.2 - Prob. 29ECh. 12.2 - 30. Average Employee Salary A company has
15...Ch. 12.2 - Grade-Point Averages Find the grade-point average...Ch. 12.2 - Grade-Point Averages Find the grade-point average...Ch. 12.2 - Prob. 33ECh. 12.2 - Federal Budget Totals The table gives federal...Ch. 12.2 - Prob. 35ECh. 12.2 - World Cell Phone Use In 2012, just the top six...Ch. 12.2 - Prob. 37ECh. 12.2 - Crew, Passengers, and Hijackers on 3/11 Airliners...Ch. 12.2 - Prob. 39ECh. 12.2 - Olympic Medal Standings The top ten medal-winning...Ch. 12.2 - Prob. 41ECh. 12.2 - Olympic Medal Standings The top ten medal-winning...Ch. 12.2 - Prob. 43ECh. 12.2 - In Exercises 44 and 45, use the given...Ch. 12.2 - Prob. 45ECh. 12.2 - What does your box plot of Exercise 18 for...Ch. 12.2 - Prob. 47ECh. 12.2 - Prob. 48ECh. 12.2 - Prob. 49ECh. 12.2 - Prob. 50ECh. 12.2 - Prob. 51ECh. 12.2 - Prob. 52ECh. 12.2 - Prob. 53ECh. 12.2 - Prob. 54ECh. 12.2 - Prob. 55ECh. 12.2 - Prob. 56ECh. 12.2 - Prob. 57ECh. 12.2 - Prob. 58ECh. 12.2 - For Exercises 57-59, refer to the grouped...Ch. 12.2 - Prob. 60ECh. 12.3 - 1. If your calculator finds both the sample...Ch. 12.3 - 2. If your calculator finds only one kind of...Ch. 12.3 - Find (a) the range, and (b) the standard deviation...Ch. 12.3 - Find (a) the range, and (b) the standard deviation...Ch. 12.3 - Find (a) the range, and (b) the standard deviation...Ch. 12.3 - Find (a) the range, and (b) the standard deviation...Ch. 12.3 - Find (a) the range, and (b) the standard deviation...Ch. 12.3 - Find (a) the range, and (b) the standard deviation...Ch. 12.3 - Find (a) the range, and (b) the standard deviation...Ch. 12.3 - Find (a) the range, and (b) the standard deviation...Ch. 12.3 - Use Chebyshev’s theorem for Exercises 11-22. Give...Ch. 12.3 - Use Chebyshev's theorem for Exercises 11-22. Give...Ch. 12.3 - Use Chebyshev's theorem for Exercises 11-22. Give...Ch. 12.3 - Use Chebyshev's theorem for Exercises 11-22. Give...Ch. 12.3 - Prob. 15ECh. 12.3 - Use Chebyshev's theorem for Exercises 11-22. Give...Ch. 12.3 - Prob. 17ECh. 12.3 - Use Chebyshev's theorem for Exercises 11-22. Give...Ch. 12.3 - Use Chebyshev's theorem for Exercises 11-22. Give...Ch. 12.3 - Use Chebyshev's theorem for Exercises 11-22. Give...Ch. 12.3 - Prob. 21ECh. 12.3 - Use Chebyshev's theorem for Exercises 11-22. Give...Ch. 12.3 - Prob. 23ECh. 12.3 - Travel Accommodation CostsGabriel and Lucia took a...Ch. 12.3 - Travel Accommodation Costs Gabriel and Lucia took...Ch. 12.3 - Travel Accommodation Costs Gabriel and Lucia took...Ch. 12.3 - Travel Accommodation Costs Gabriel and Lucia took...Ch. 12.3 - Travel Accommodation Costs Gabriel and Lucia took...Ch. 12.3 - In Exercises 29 and 30, two samples are given. In...Ch. 12.3 - In Exercises 29 and 30, two samples are given. In...Ch. 12.3 - Utilize the following sample for Exercises...Ch. 12.3 - Utilize the following sample for Exercises 31-36....Ch. 12.3 - Prob. 33ECh. 12.3 - Utilize the following sample for Exercises...Ch. 12.3 - Prob. 35ECh. 12.3 - Utilize the following sample for Exercises...Ch. 12.3 - 37. Comparing Water Heater Lifetimes Two brands of...Ch. 12.3 - Lifetimes of Engine Control Modules Chin manages...Ch. 12.3 - Lifetimes of Engine Control Modules Chin manages...Ch. 12.3 - Prob. 40ECh. 12.3 - 41. In Section 12.2 we showed that the mean, as a...Ch. 12.3 - Prob. 42ECh. 12.3 - A Cereal-Marketing Survey A food distribution...Ch. 12.3 - A Cereal-Marketing Survey A food distribution...Ch. 12.3 - A Cereal-Marketing Survey A food distribution...Ch. 12.3 - Prob. 46ECh. 12.3 - Prob. 47ECh. 12.3 - Prob. 48ECh. 12.3 - Prob. 49ECh. 12.3 - Prob. 50ECh. 12.3 - Prob. 51ECh. 12.3 - Prob. 52ECh. 12.4 - Numbers of Restaurant Customers Refer to the...Ch. 12.4 - Numbers of Restaurant Customers Refer to the...Ch. 12.4 - Numbers of Restaurant Customers Refer to the...Ch. 12.4 - Numbers of Restaurant Customers Refer to the...Ch. 12.4 - In Exercises 5-8, make use of z-scores.
5....Ch. 12.4 - In Exercises 5-8, make use of z-scores.
6....Ch. 12.4 - In Exercises 5-8, make use of z-scores.
7....Ch. 12.4 - In Exercises 5-8, make use of z-scores. Relative...Ch. 12.4 - World's Largest Energy Producers and Consumers The...Ch. 12.4 - World's Largest Energy Producers and Consumers The...Ch. 12.4 - World's Largest Energy Producers and Consumers The...Ch. 12.4 - World's Largest Energy Producers and Consumers The...Ch. 12.4 - World's Largest Energy Producers and Consumers The...Ch. 12.4 - World's Largest Energy Producers and ConsumersThe...Ch. 12.4 - World's Largest Energy Producers and Consumers The...Ch. 12.4 - World's Largest Energy Producers and Consumers The...Ch. 12.4 - Determine which was relatively higher: Canada in...Ch. 12.4 - Construct box plots for both production and...Ch. 12.4 - Prob. 19ECh. 12.4 - 20. Comparing your two box plots of Exercise 18,...Ch. 12.4 - The text stated that for any distribution of data,...Ch. 12.4 - 22. Describe the basic difference between a...Ch. 12.4 - Prob. 23ECh. 12.4 - This chapter has introduced three major...Ch. 12.4 - Prob. 25ECh. 12.4 - Prob. 26ECh. 12.4 - Prob. 27ECh. 12.4 - Prob. 28ECh. 12.4 - Prob. 29ECh. 12.4 - Prob. 30ECh. 12.4 - Prob. 31ECh. 12.4 - Prob. 32ECh. 12.4 - In Exercises 32-35, answer yes or no and explain...Ch. 12.4 - In Exercises 32-35, answer yes or no and explain...Ch. 12.4 - In Exercises 32-35, answer yes or no and explain...Ch. 12.4 - Prob. 36ECh. 12.4 - Prob. 37ECh. 12.4 - Prob. 38ECh. 12.4 - Prob. 39ECh. 12.4 - Prob. 40ECh. 12.4 - Prob. 41ECh. 12.4 - Prob. 42ECh. 12.4 - Prob. 43ECh. 12.4 - Prob. 44ECh. 12.4 - Prob. 45ECh. 12.4 - Prob. 46ECh. 12.4 - Prob. 47ECh. 12.4 - Prob. 48ECh. 12.4 - Prob. 49ECh. 12.4 - Prob. 50ECh. 12.4 - Prob. 51ECh. 12.4 - Prob. 52ECh. 12.4 - Prob. 53ECh. 12.4 - Prob. 54ECh. 12.5 - Identify each variable quantity as discrete or...Ch. 12.5 - Identify each variable quantity as discrete or...Ch. 12.5 - Identify each variable quantity as discrete or...Ch. 12.5 - Prob. 4ECh. 12.5 - Identify each variable quantity as discrete or...Ch. 12.5 - Prob. 6ECh. 12.5 - Measuring the Mass of Ore Samples Suppose 100...Ch. 12.5 - Measuring the Mass of Ore Samples Suppose 100...Ch. 12.5 - Measuring the Mass of Ore Samples Suppose 100...Ch. 12.5 - Measuring the Mass of Ore Samples Suppose 100...Ch. 12.5 - Distribution of IQ Scores On standard IQ tests,...Ch. 12.5 - Distribution of IQ Scores On standard IQ tests,...Ch. 12.5 - Distribution of IQ Scores On standard IQ tests,...Ch. 12.5 - Distribution of IQ Scores On standard IQ tests,...Ch. 12.5 - Find the percentage of area under a normal curve...Ch. 12.5 - Find the percentage of area under a normal curve...Ch. 12.5 - Find the percentage of area under a normal curve...Ch. 12.5 - Find the percentage of area under a normal curve...Ch. 12.5 - Find the percentage of the total area under a...Ch. 12.5 - Find the percentage of the total area under a...Ch. 12.5 - Find the percentage of the total area under a...Ch. 12.5 - Find the percentage of the total area under a...Ch. 12.5 - Find a value of z such that each condition is met....Ch. 12.5 - Find a value of z such that each condition is met....Ch. 12.5 - Find a value of z such that each condition
25....Ch. 12.5 - Find a value of z such that each condition is...Ch. 12.5 - Weights of Peaches A fruit-packing company...Ch. 12.5 - Weights of Peaches A fruit-packing company...Ch. 12.5 - Weights of Peaches A fruit-packing company...Ch. 12.5 - Weights of Peaches A fruit-packing company...Ch. 12.5 - Weights of Peaches A fruit-packing company...Ch. 12.5 - Prob. 32ECh. 12.5 - Prob. 33ECh. 12.5 - Prob. 34ECh. 12.5 - IQs of Employees A large company employs workers...Ch. 12.5 - Prob. 36ECh. 12.5 - Net Weight of Cereal Boxes A certain dry cereal is...Ch. 12.5 - Prob. 38ECh. 12.5 - Prob. 39ECh. 12.5 - Net Weight of Cereal Boxes A certain dry cereal is...Ch. 12.5 - Prob. 41ECh. 12.5 - Prob. 42ECh. 12.5 - Prob. 43ECh. 12.5 - Prob. 44ECh. 12.5 - Assume the following distributions are all normal,...Ch. 12.5 - Prob. 46ECh. 12.5 - Prob. 47ECh. 12.5 - Prob. 48ECh. 12.5 - Prob. 49ECh. 12.5 - Prob. 50ECh. 12.5 - Prob. 51ECh. 12.5 - Prob. 52ECh. 12.5 - Prob. 53ECh. 12.5 - Prob. 54ECh. 12.5 - Prob. 55ECh. 12.5 - Prob. 56ECh. 12.5 - Prob. 57ECh. 12.5 - Prob. 58ECh. 12.5 - Prob. 59ECh. 12.5 - Prob. 60ECh. 12.5 - What percentage of the items lie within 1.25...Ch. 12.5 - Prob. 62ECh. 12 - Visits to Social Networking Sites The table shows...Ch. 12 - Cheaters Never Learn The table here shows the...Ch. 12 - Use this information for Exercises 3 and 4. For...Ch. 12 - Prob. 4TCh. 12 - College Endowment AssetsThe table shows the top...Ch. 12 - College Endowment Assets The table shows the top...Ch. 12 - College Endowment Assets The table shows the top...Ch. 12 - Prob. 8TCh. 12 - Pediatrics Patients Khalida worked the 22 weekdays...Ch. 12 - Prob. 10TCh. 12 - In Exercises 11-14, find the indicated measures...Ch. 12 - In Exercises 11-14, find the indicated measures...Ch. 12 - In Exercises 11-14, find the indicated measures...Ch. 12 - Prob. 14TCh. 12 - Exam Scores in a Criminal Justice Class The...Ch. 12 - Prob. 16TCh. 12 - Use the stem-and-leaf display below for Exercises...Ch. 12 - Prob. 18TCh. 12 - Use the stem-and-leaf display below for Exercises...Ch. 12 - Use the stem-and-leaf display below for...Ch. 12 - Use the stem-and-leaf display below for...Ch. 12 - Prob. 22TCh. 12 - Triple Jump ChampionsAll Summer Olympic...Ch. 12 - Prob. 24TCh. 12 - Season Statistics in Major League Baseball The...Ch. 12 - Season Statistics in Major League Baseball The...Ch. 12 - Season Statistics in Major League Baseball The...Ch. 12 - Prob. 28TCh. 12 - Remission Data for Cocaine and Marijuana Addiction...Ch. 12 - Remission Data for Cocaine and Marijuana Addiction...
Knowledge Booster


Learn more about
Need a deep-dive on the concept behind this application? Look no further. Learn more about this topic, subject and related others by exploring similar questions and additional content below.Similar questions
- Find the mean hourly cost when the cell phone described above is used for 240 minutes.arrow_forwardThe Oxford Dictionary defines the word nominal asa value that is “stated or expressed but notnecessarily corresponding exactly to the real value.[18]Develop a reasonable argument for why the termnominal rate is used to describe the annual percentagerate of an investment account that compoundsinterest.arrow_forwardWhat is the total effect on the economy of a government tax rebate of $500 to each household in order to stimulate the economy if each household will spend of the rebate in goods and services?arrow_forward
- What does the y -intercept on the graph of a logistic equation correspond to for a population modeled by that equation?arrow_forwardA famous Chinese restaurant would like to find out the change in demand on its dim-sum. After checking its purchase records in 2020 and 2021, the restaurant collected the data as follows: 2020 2021 Items Price ($) Quantity Price ($) Quantity Shrimp Dumpling 10 60 12 69 Spring Roll 7 51 62 Chicken Feet 8 73 9 77 (a) Using 2020 as the base year, calculate the Laspeyres Price Index of 2021. (b) Using 2020 as the base year, calculate the Paasche Price Index of 2021. (c) Using the result in part (a) and (b), calculate the Fisher Price Index of 2021.arrow_forwardThe following table gives information on the Consumer Price Index (Base = 1982–84) and the monthly take-home pay of Bill Martin, an employee at Ford Motor Corporation, from 1982−84 and 2018. Consumer Price Index Mr. Martin’s Monthly Year (1982−84 = 100) Take-Home Pay 1982−84 100.0 $ 600 2018 251.107 7,000arrow_forward
- The following information is from General Electric Corporation's annual reports. Compute a simple index for the number of employees for GE using the period 2013 as the base. (Round your answers to 1 decimal place.)The index (2013 = 100) for selected years is: What can you conclude about the change in the number of employees over the period? (Round your answer to 1 decimal place.)arrow_forwardPlease help me and show me all steps .arrow_forwardThe table below reports the annual stock price in September for Apple from 2005 to 2014. Develop a simple index for the change in earning per share over the period. Use 2005 as the base period. percentages (e.g. 131.32 instead of 1.31)) (Indexes should be rounded to 2 decimal places and be in Year Earnings Per Share ($) Simple Index 2005 4.32 2006 4.14 2007 4.86 2008 5.94 2009 6.76 2010 10.08 2011 16.51 2012 23.65 2013 26.21 2014 29.86 Click here for the Excel Data File, Data file should open in a new browswer window. Select "File" then "Save As" to download the file to your computer and be able to use it in Excel. a. By what percent have stock prices changed from 2005 to 2009? b. By what percent have stock prices changed from 2005 to 2014? c. By what percent have stock prices changed from 2009 to 2014?arrow_forward
- The following table shows the Consumer Price Index (CPI), which uses the year 1983 as a baseline (1983 100%). What is the equivalent 1983 yearly salary to a worker who earned $40,000 in the year 2010? Round to the nearest cent. Year 2010 CPI 220.22 2009 216.69 2008 211.14 2007 211.08 2006 202.42 2005 198.3 2004 190.7arrow_forwardMeat and gasoline are two important components of the household budget in typical American homes, especially in lower income households. The figure below shows the evolution of average prices for Ground beef (per pound) and Gasoline (per gallon) for the 2001-2021 period in the United States. Average price data (in U.S. dollars), selected items Bananas, per lb. Bread, white, pan, per lb.. Chicken, fresh, whole, per lb. Eggs, grade A, large, per doz. Ground chuck, 100% beef, per lb. - Milk, fresh, whole, fortified, per gal. $6.00 $4.00 Lampions $2.00 $0.00 Aug 2001 Aug 2003 ...... A Aug 2005 Oranges, Navel, per lb. Tomatoes, field grown, per lb. Electricity per KWH Gasoline, unleaded regular, per gallon Utility (piped) gas per therm Aug 2007 Mummy Aug 2009 Aug 2011 Aug 2013 Aug 2015 Aug 2017 Aug 2019 Aug 2021 Hover over chart to view data. Note Shaded area represents recession, as determined by the National Bureau of Economic Research.. Source US. Bureau of Labor Statistics. Figure 1.…arrow_forwardExample 20.2 Using the data given in Table 20.2, calculate the price index for year 2, the base year being year 1.arrow_forward
arrow_back_ios
SEE MORE QUESTIONS
arrow_forward_ios
Recommended textbooks for you

 Glencoe Algebra 1, Student Edition, 9780079039897...AlgebraISBN:9780079039897Author:CarterPublisher:McGraw Hill
 College Algebra (MindTap Course List)AlgebraISBN:9781305652231Author:R. David Gustafson, Jeff HughesPublisher:Cengage Learning
 Trigonometry (MindTap Course List)TrigonometryISBN:9781337278461Author:Ron LarsonPublisher:Cengage Learning

Glencoe Algebra 1, Student Edition, 9780079039897...
Algebra
ISBN:9780079039897
Author:Carter
Publisher:McGraw Hill
College Algebra (MindTap Course List)
Algebra
ISBN:9781305652231
Author:R. David Gustafson, Jeff Hughes
Publisher:Cengage Learning
Trigonometry (MindTap Course List)
Trigonometry
ISBN:9781337278461
Author:Ron Larson
Publisher:Cengage Learning
Time Series Analysis Theory & Uni-variate Forecasting Techniques; Author: Analytics University;https://www.youtube.com/watch?v=_X5q9FYLGxM;License: Standard YouTube License, CC-BY
Operations management 101: Time-series, forecasting introduction; Author: Brandoz Foltz;https://www.youtube.com/watch?v=EaqZP36ool8;License: Standard YouTube License, CC-BY