
Concept explainers
Videos
(a)
To make an appropriate
(a)
Explanation of Solution
In the question Mr. Starnes designed a study to examine the questions that does the color in which words are printed affect your ability to read them and so the words themselves affect your ability to name the color in which they are printed. Thus, the scatterplot for this data will be as:
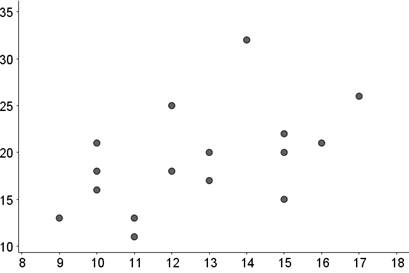
Thus, by looking at the scatterplot we can say that,
Direction: It is positive because the scatterplot slopes upward.
Form: It is linear because the points seem to roughly line about a line.
Strength: It is moderate because the points do not lie apart but not close together either.
Thus the scatterplot suggest a moderate positive linear relationship between the words and colors.
(b)
To use your calculator to find the equation of the least squares regression line.
(b)
Answer to Problem 30E
Explanation of Solution
In the question Mr. Starnes designed a study to examine the questions that does the color in which words are printed affect your ability to read them and so the words themselves affect your ability to name the color in which they are printed. Using calculator, press on STAT and then select
Next, press on STAT select CALC and then select
Finally, pressing on ENTER then gives us the following result:
This then implies the regression line as:
with
(c)
To find out what is the residual who completed the word task in
(c)
Answer to Problem 30E
Residual is
Explanation of Solution
In the question Mr. Starnes designed a study to examine the questions that does the color in which words are printed affect your ability to read them and so the words themselves affect your ability to name the color in which they are printed. And we have the regression line as:
with
Now, it is given that,
Thus, using the regression line in the part (b), we evaluate the result as:
Thus, as we know that the residual is actual minus the predicted values, then,
Thus, the predicted number of colors for the student who completed the word task in
(d)
To explain what does this value means in this context.
(d)
Explanation of Solution
In the question Mr. Starnes designed a study to examine the questions that does the color in which words are printed affect your ability to read them and so the words themselves affect your ability to name the color in which they are printed. It is given in the question that,
Thus, the P-value is the probability of obtaining the value of test statistics or a value more extreme if the null hypothesis is true. So, if the slope of the population regression line is zero, then the probability of obtaining a similar or more extreme sample than the given sample is
Chapter 12 Solutions
The Practice of Statistics for AP - 4th Edition
Additional Math Textbook Solutions
Elementary Statistics Using Excel (6th Edition)
Basic Business Statistics, Student Value Edition (13th Edition)
Essentials of Statistics (6th Edition)
Statistical Reasoning for Everyday Life (5th Edition)
Elementary Statistics: Picturing the World (7th Edition)


 MATLAB: An Introduction with ApplicationsStatisticsISBN:9781119256830Author:Amos GilatPublisher:John Wiley & Sons Inc
 Probability and Statistics for Engineering and th...StatisticsISBN:9781305251809Author:Jay L. DevorePublisher:Cengage Learning
 Statistics for The Behavioral Sciences (MindTap C...StatisticsISBN:9781305504912Author:Frederick J Gravetter, Larry B. WallnauPublisher:Cengage Learning
 Elementary Statistics: Picturing the World (7th E...StatisticsISBN:9780134683416Author:Ron Larson, Betsy FarberPublisher:PEARSON
 The Basic Practice of StatisticsStatisticsISBN:9781319042578Author:David S. Moore, William I. Notz, Michael A. FlignerPublisher:W. H. Freeman
 Introduction to the Practice of StatisticsStatisticsISBN:9781319013387Author:David S. Moore, George P. McCabe, Bruce A. CraigPublisher:W. H. Freeman