
Concept explainers
Videos
(a)
To make a reasonable accurate
(a)
Explanation of Solution
Now, the scatterplot of the data using the time as the explanatory variable is as follows:
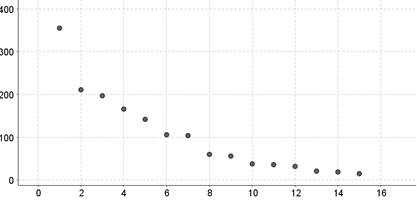
Thus, by looking at the scatterplot we can see that,
Direction: Negative, because the scatterplot slopes downwards.
Form: Curved, because the points do not lie on a straight line.
Strength: Strong, because all points lie very close together in the same pattern.
We also note an outlier in the upper left corner of the scatterplot.
(b)
To explain why it would be reasonable to use an exponential model to describe the relationship between the count of bacteria and time.
(b)
Explanation of Solution
Now, the data of the count of bacteria and the time is given in the question. Thus, we can say that it would be reasonable to use an exponential model to describe the relationship between the count of bacteria and time because the corresponding scatterplot has a roughly linear pattern with no notable strong outliers as we can see in the scatterplot in the part (a).
(c)
To give the equation of the least squares regression line.
(c)
Answer to Problem 37E
Explanation of Solution
Now, it is given that t is the time and y is the count of bacteria. Thus the transformation is the natural logarithm of the count as
Thus, as we know that the general equation of the regression line is as follows:
And the slope and the constant given in the computer output is as:
Thus, the regression line is as follows:
(d)
To use your model to predict the number of surviving bacteria after
(d)
Answer to Problem 37E
Explanation of Solution
Now, the regression line is as follows:
Thus, we will evaluate the equation as:
Since the pattern of the residual in the residual plot is centered at zero we expect the predict to be about right.
Chapter 12 Solutions
The Practice of Statistics for AP - 4th Edition
Additional Math Textbook Solutions
Statistical Reasoning for Everyday Life (5th Edition)
Statistics: The Art and Science of Learning from Data (4th Edition)
STATS:DATA+MODELS-W/DVD
An Introduction to Mathematical Statistics and Its Applications (6th Edition)
Basic Business Statistics, Student Value Edition
Elementary Statistics: Picturing the World (6th Edition)


 MATLAB: An Introduction with ApplicationsStatisticsISBN:9781119256830Author:Amos GilatPublisher:John Wiley & Sons Inc
 Probability and Statistics for Engineering and th...StatisticsISBN:9781305251809Author:Jay L. DevorePublisher:Cengage Learning
 Statistics for The Behavioral Sciences (MindTap C...StatisticsISBN:9781305504912Author:Frederick J Gravetter, Larry B. WallnauPublisher:Cengage Learning
 Elementary Statistics: Picturing the World (7th E...StatisticsISBN:9780134683416Author:Ron Larson, Betsy FarberPublisher:PEARSON
 The Basic Practice of StatisticsStatisticsISBN:9781319042578Author:David S. Moore, William I. Notz, Michael A. FlignerPublisher:W. H. Freeman
 Introduction to the Practice of StatisticsStatisticsISBN:9781319013387Author:David S. Moore, George P. McCabe, Bruce A. CraigPublisher:W. H. Freeman