
Videos
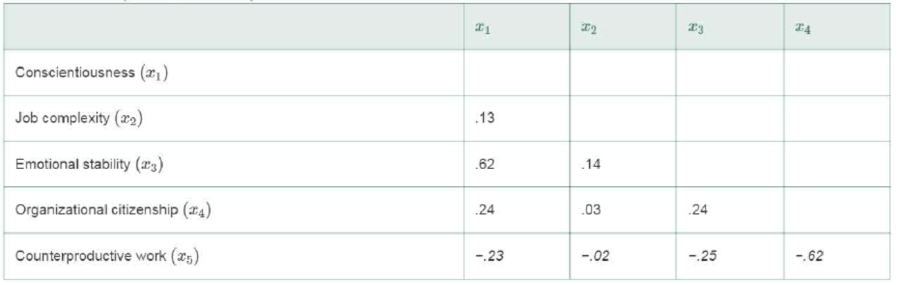
Personality traits and job performance. Refer to the Journal of Applied Psychology (January 2011) study of the determinants of task performance, Exercise 12.94 (p. 742). In addition to x1 = conscientiousness score and x2 = {1 if highly complex job, 0 if not}, the researchers also used x3 = emotional stability score, x4 = organizational citizenship behavior score, and x5 = counterproductive work behaveior scorce to model y = task performance score. One of their concerns is the level of multicollinearity in the data. Below is a matrix of
Want to see the full answer?
Check out a sample textbook solution
Chapter 12 Solutions
STATISTICSMYSTAT LAB ACCESS CODE + PHS


- A survey of 750 likely voters in Ohio was conducted by the Rasmussen Poll just prior tothe general election (Rasmussen Reports website, November 4, 2012). The state of theeconomy was thought to be an important determinant of how people would vote. Amongother things, the survey found that 165 of the respondents rated the economy as good orexcellent and 315 rated the economy as poor.a. Develop a point estimate of the proportion of likely voters in Ohio who rated theeconomy as good or excellent.b. Construct a 95% confidence interval for the proportion of likely voters in Ohio whorated the economy as good or excellent.c. Construct a 95% confidence interval for the proportion of likely voters in Ohio whorated the economy as poor.d. Which of the confidence intervals in parts (b) and (c) is wider? Why?arrow_forwardIf my hypothesis assumes that religious women are more satisfied with life than men, would gender be my dependent variable? Religion and satisfaction with life are both independent? Is that correct?arrow_forwardSuppose that X represents the number of years a person goes to school, and Y represents the income they earn after finishing those years of school. Years of schooling is widely believed to be a major determinant of income. The correlation between education and earnings is positive. Explain whether this correlation is likely to be causal or not.arrow_forward
- Consider that the results of a research study conclude that the “effect of social media use on anxiety depends on gender.” Which statement below is correct based on this conclusion? a. The research study uncovered a main effect of social media use, but no main effect of gender or interaction between gender and social media use. b. The research study uncovered a main effect of gender and interaction of gender and social media use, but not main effect of social media use. c. The research study uncovered an interaction between social media use and gender, but no main effects. d. The research study uncovered no main effects of gender or social media use, as well as no interaction between gender and social media use.arrow_forwardThe relationship between the independent variable (IV) and the dependent variable (DV) is likely to be mediated by a third variable (MV). With regard to the statement above, which of the following is most likely to be correct? A IV = Students’ performance (i.e., marks) in the formative assessment; DV = Students’ performance (i.e., marks) in the summative assessment, and MV = Students’ level of comfort with the venue of the assessments B IV = Students’ performance (i.e., marks) in the summative assessment; DV = Students’ performance (i.e., marks) in the formative assessment, and MV = Students’ level of preparation for the assessments. C IV = Students’ performance (i.e., marks) in the formative assessment; DV = Students’ performance (i.e., marks) in the summative assessment, and MV = Students’ level of preparation for the assessments D IV = Students’ performance (i.e., marks) in the summative assessment; DV = Students’ performance (i.e., marks) in the formative assessment,…arrow_forwardSuppose you have obtained from SPSS the correlation matrix in Appendix 1. According to the information in this matrix, which two variables exhibit the strongest linear relationship?arrow_forward
- A researcher analyzing the determinants of earnings and she has data on 16 occupation categories that exhausts all possibilities. If the researcher runs a regression of earnings on a binary (dummy variable) for all 16 categories, which least-square assumption is violated?arrow_forwardA possible important environmental determinant of lung function in children is the amount of cigarette smoking in the home. Suppose this question is studied by selecting two groups: Group 1 consists of 23 nonsmoking children 5-9 years of age, both of whose parents smoke, who have a mean forced expiratory volume (FEV) of 2.1 L and a standard deviation of 0.7 L; group 2 consists of 20 nonsmoking children of comparable age, neither of whose parents smoke, who have a mean FEV of 2.3 L and a standard deviation of 0.4 L.*8.31 What are the appropriate null and alternative hypotheses to compare the means of the two groups? *8.32 What is the appropriate test procedure for the hypotheses in Problem 8.31? *8.33 Carry out the test in Problem 8.32 using the criticalvalue method. *8.34 Provide a 95% CI for the true mean difference in FEV between 5- to 9-year-old children whose parents smoke and comparable children whose parents do not smoke. *8.35 Assuming this is regarded as a pilot study, how many…arrow_forwardWhich scatterplot shows a nonlinear association?arrow_forward
- Economists, Angrist and Lavy (1999) exploited an 800 year-old rule regarding classroom size to estimate the causal effect of smaller classes on student achievement. The rule, made famous by 12th century scholar Maimonides, states that one teacher is sufficient to manage a class with up to 40 students. Classes with more than 40 students will require 2 teachers. Angrist and Lavy noticed that strict application of this rule in certain areas meant that if 80 students were enrolled in a school, then the school would divide them up into two groups of 40 students per teacher. If 81 students were enrolled, however, they would be placed in three classes of 27 students each. The rule thus generated sharp discontinuities in class sizes within schools, which, the authors argue, allow them to provide causal evidence of a boost in fifth grade math and reading scores as a result of smaller class size. a. What research design is implied by the authors’ use of Maimonides’ rule to estimate the causal…arrow_forwardIf two variables are associated, does that mean they are necessarily causally related and What info is additionally needed?arrow_forwardAn interaction effect can be defined as the effect ______. A. that does not occur between the independent variables and the dependent variables B. of one independent variable at one of the levels of another independent variable C. of an independent variable within a single-factor research design D. of one independent variable on the dependent variable changing at the different levels of another independent variablearrow_forward
 MATLAB: An Introduction with ApplicationsStatisticsISBN:9781119256830Author:Amos GilatPublisher:John Wiley & Sons Inc
 Probability and Statistics for Engineering and th...StatisticsISBN:9781305251809Author:Jay L. DevorePublisher:Cengage Learning
 Statistics for The Behavioral Sciences (MindTap C...StatisticsISBN:9781305504912Author:Frederick J Gravetter, Larry B. WallnauPublisher:Cengage Learning
 Elementary Statistics: Picturing the World (7th E...StatisticsISBN:9780134683416Author:Ron Larson, Betsy FarberPublisher:PEARSON
 The Basic Practice of StatisticsStatisticsISBN:9781319042578Author:David S. Moore, William I. Notz, Michael A. FlignerPublisher:W. H. Freeman
 Introduction to the Practice of StatisticsStatisticsISBN:9781319013387Author:David S. Moore, George P. McCabe, Bruce A. CraigPublisher:W. H. Freeman