
STATISTICSMYSTAT LAB ACCESS CODE + PHS
13th Edition
ISBN: 9780134613949
Author: MCCLAVE
Publisher: PEARSON
expand_more
expand_more
format_list_bulleted
Concept explainers
Videos
Textbook Question
Chapter 12.4, Problem 12.27ACB
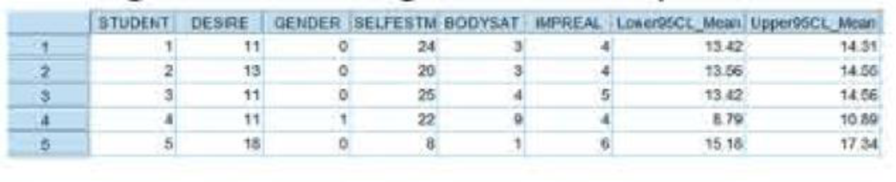
Reality TV and cosmetic surgery. Refer to the Body Image: An International Journal of Research (March 201 0) study of the impact of reality TV shows on one's desire to undergo cosmetic surgery, Exercise 12.17. (p. 701). Recall that - psychologists used multiple regression to model desire to have cosmetic surgery (y) as a
- a. Interpret the confidence interval for E(y) for student 1.
- b. Interpret the confidence interval for E(y) for student 4.
Expert Solution & Answer
Want to see the full answer?
Check out a sample textbook solution
Students have asked these similar questions
The new manager of an Information Technology company collected data for a sample of 20 computer programmers in the organization to perform a multiple regression analysis on the structure of their salaries. The aim of this manager in this exercise is to determine if the Salary (y) of a hired computer programmer was related to the years of Experience (??) in the organization and also the Score (??) of the programmers during their first interview aptitude test scores. The years of experience, score on the aptitude test and the corresponding annual salary (in thousands of Ghana cedis) for a sample of the 20 programmers is shown in the Regression statistics table below;
Experience (??)
(in years)
Score (??) (out of 100%)
Salary (y)
(GH¢ 000)
4
78
24
7
100
43
1
86
23.7
5
82
34.3
8
86
35.8
10
84
38
0
75
22.2
1
80
23.1
6
83
30
6
91
33
9
88
38
2
73
26.6
10
75
36.2
5
81
31.6…
If a scatterplot is created in excel, and a line of regression is fit along with a derived functional form, what does it mean to describe and interpret them? What conclusions would be made about relationships between two recorded variables?
Chapter 12 Solutions
STATISTICSMYSTAT LAB ACCESS CODE + PHS
Ch. 12.3 - Write a first-order model relating E(y) to a. two...Ch. 12.3 - Minitab was used to fit the model E(y) = (0 + 1x1...Ch. 12.3 - Suppose you fit the multiple regression model y =0...Ch. 12.3 - Suppose you fit the first-order multiple...Ch. 12.3 - Prob. 12.5LMCh. 12.3 - Prob. 12.6LMCh. 12.3 - Prob. 12.7LMCh. 12.3 - If the analysis of variance F-test leads to the...Ch. 12.3 - Ambiance of 5-star hotels. Although invisible and...Ch. 12.3 - Forecasting movie revenues with Twitter. Refer to...
Ch. 12.3 - Accounting and Machiavellianism. Refer to the...Ch. 12.3 - Prob. 12.12ACBCh. 12.3 - Predicting elements in aluminum alloys. Aluminum...Ch. 12.3 - Novelty of a vacation destination. Many tourists...Ch. 12.3 - Arsenic in groundwater. Environmental Science ...Ch. 12.3 - Reality TV and cosmetic surgery. How much...Ch. 12.3 - Contamination from a plant's discharge. Refer to...Ch. 12.3 - Cooling method for gas turbines. Refer to the...Ch. 12.3 - Rankings of research universities. Refer to the...Ch. 12.3 - Bubble behavior in subcooled flow boiling. In...Ch. 12.3 - Prob. 12.22ACICh. 12.3 - Prob. 12.23ACACh. 12.3 - Prob. 12.24ACACh. 12.4 - Characteristics of lead users. Refer to the...Ch. 12.4 - Prob. 12.26ACBCh. 12.4 - Reality TV and cosmetic surgery. Refer to the Body...Ch. 12.4 - Chemical plant contamination. Refer to Exercise...Ch. 12.4 - Prob. 12.29ACBCh. 12.4 - Arsenic in groundwater. Refer to the Environmental...Ch. 12.4 - Prob. 12.32ACICh. 12.4 - Prob. 12.33ACICh. 12.4 - Boiler drum production. In a production facility,...Ch. 12.5 - Suppose the true relationship between E(y) and the...Ch. 12.5 - Suppose you fit the interaction model y = 0 + x1 +...Ch. 12.5 - Prob. 12.37LMCh. 12.5 - Tipping behavior in restaurants. Can food servers...Ch. 12.5 - Forecasting movie revenues with Twitter. Refer to...Ch. 12.5 - Prob. 12.41ACBCh. 12.5 - Prob. 12.42ACBCh. 12.5 - Reality TV and cosmetic surgery. Refer to the Body...Ch. 12.5 - Factors that impact an auditors judgment. A study...Ch. 12.5 - Service workers and customer relations. A study in...Ch. 12.5 - Bubble behavior in subcooled flow boiling. Refer...Ch. 12.5 - Arsenic in groundwater. Refer to the Environmental...Ch. 12.5 - Cooling method for gas turbines. Refer to the...Ch. 12.6 - Write a second-order model relating the mean of y,...Ch. 12.6 - Prob. 12.50LMCh. 12.6 - Prob. 12.51LMCh. 12.6 - Prob. 12.52LMCh. 12.6 - Minitab was used to fit the complete second-order...Ch. 12.6 - Personality traits and job performance. When...Ch. 12.6 - Going for it on fourth-down in the NFL. Refer to...Ch. 12.6 - Prob. 12.56ACBCh. 12.6 - Prob. 12.57ACBCh. 12.6 - Assertiveness and leadership. Management...Ch. 12.6 - Goal congruence in top management teams. Do chief...Ch. 12.6 - Prob. 12.60ACICh. 12.6 - Revenues of popular movies. The Internet Movie...Ch. 12.6 - Prob. 12.62ACICh. 12.6 - Prob. 12.63ACICh. 12.6 - Prob. 12.64ACICh. 12.6 - Prob. 12.65ACICh. 12.7 - Write a regression model relating the mean value...Ch. 12.7 - Prob. 12.67LMCh. 12.7 - Prob. 12.68LMCh. 12.7 - Prob. 12.69LMCh. 12.7 - Prob. 12.70ACBCh. 12.7 - Prob. 12.71ACBCh. 12.7 - Prob. 12.72ACBCh. 12.7 - Prob. 12.73ACBCh. 12.7 - Buy-side vs. sell-side analysts earnings...Ch. 12.7 - Prob. 12.75ACBCh. 12.7 - Charisma of top-level leaders. Refer to the...Ch. 12.7 - Corporate sustainability and firm characteristics....Ch. 12.7 - Homework assistance for accounting students. Refer...Ch. 12.7 - Improving driving performance while fatigued....Ch. 12.7 - Prob. 12.80ACACh. 12.7 - Banning controversial sports team sponsors. Refer...Ch. 12.8 - Consider a multiple regression model for a...Ch. 12.8 - Prob. 12.83LMCh. 12.8 - Consider the model: y = 0+ 1x1+ 2 x2+ 3 x3+...Ch. 12.8 - Consider the model:...Ch. 12.8 - Prob. 12.86LMCh. 12.8 - Reality TV and cosmetic surgery. Refer to the Body...Ch. 12.8 - Do blondes raise more funds? Refer to the Economic...Ch. 12.8 - Prob. 12.89ACBCh. 12.8 - Buy-side vs. sell-side analysts earnings...Ch. 12.8 - Workplace bullying and intention to leave....Ch. 12.8 - Agreeableness, gender, and wages. Do agreeable...Ch. 12.8 - Chemical plant contamination. Refer to Exercise...Ch. 12.8 - Prob. 12.94ACICh. 12.8 - Recently sold, single-family homes. The National...Ch. 12.8 - Charisma of top-level leaders Refer to the Academy...Ch. 12.9 - Determine which pairs of the following models are...Ch. 12.9 - Prob. 12.98LMCh. 12.9 - Prob. 12.99LMCh. 12.9 - Shared leadership in airplane crews. Refer to the...Ch. 12.9 - Buy-side vs. sell-side analysts earnings...Ch. 12.9 - Workplace bullying and intention to leave. Refer...Ch. 12.9 - Cooling method for gas turbines. Refer to the...Ch. 12.9 - Prob. 12.104ACBCh. 12.9 - Reality TV and cosmetic surgery. Refer to the Body...Ch. 12.9 - Study of supervisor-targeted aggression....Ch. 12.9 - Prob. 12.107ACICh. 12.9 - Recently sold, single-family homes. Refer to the...Ch. 12.9 - Prob. 12.109ACICh. 12.9 - Prob. 12.110ACACh. 12.10 - Prob. 12.111LMCh. 12.10 - Teacher pay and pupil performance. In Economic...Ch. 12.10 - Risk management performance. An article in the...Ch. 12.10 - Accuracy of software effort estimates....Ch. 12.10 - Diet of ducks bred for broiling. Corn is high in...Ch. 12.10 - Reality TV and cosmetic surgery. Refer to the Body...Ch. 12.10 - Prob. 12.117ACICh. 12.10 - Prob. 12.118ACICh. 12.10 - Prob. 12.119ACICh. 12.12 - Identify the problem(s) in each of the residual...Ch. 12.12 - Consider fitting the multiple regression model...Ch. 12.12 - Emotional intelligence and team performance. Refer...Ch. 12.12 - State casket sales restrictions. Some states...Ch. 12.12 - Personality traits and job performance. Refer to...Ch. 12.12 - Women in top management. Refer to the Journal of...Ch. 12.12 - Accuracy of software effort estimates. Refer to...Ch. 12.12 - Arsenic in groundwater. Refer to the Environmental...Ch. 12.12 - Reality TV and cosmetic surgery. Refer to the Body...Ch. 12.12 - Failure times of silicon wafer microchips. Refer...Ch. 12.12 - Bubble behavior in subcooled flow boiling. Refer...Ch. 12.12 - Banning controversial sports team sponsors. Refer...Ch. 12.12 - Cooling method for gas turbines. Refer to the...Ch. 12.12 - Agreeableness, gender, and wages. Refer to the...Ch. 12 - Suppose you have developed a regression model to...Ch. 12 - When a multiple regression model is used for...Ch. 12 - Suppose you fit the model y=0+1x1+2x12+3x2+4x1x2+...Ch. 12 - Prob. 12.137LMCh. 12 - Prob. 12.138LMCh. 12 - Prob. 12.139LMCh. 12 - Prob. 12.140LMCh. 12 - Prob. 12.141LMCh. 12 - Prob. 12.142LMCh. 12 - Prob. 12.143LMCh. 12 - Prob. 12.144LMCh. 12 - Comparing private and public college tuition....Ch. 12 - Prob. 12.146ACBCh. 12 - Prob. 12.147ACBCh. 12 - Highway crash data analysis. Researchers at...Ch. 12 - Prob. 12.149ACBCh. 12 - Mental health of a community. An article in the...Ch. 12 - Prob. 12.151ACBCh. 12 - Testing tires for wear. Underinflated or...Ch. 12 - Prob. 12.153ACBCh. 12 - Prob. 12.154ACBCh. 12 - Prob. 12.155ACBCh. 12 - Prob. 12.156ACBCh. 12 - Prob. 12.157ACBCh. 12 - Promotion of supermarket vegetables. A supermarket...Ch. 12 - Yield strength of steel alloy. Industrial...Ch. 12 - Prob. 12.160ACICh. 12 - Prob. 12.161ACICh. 12 - Improving Math SAT scores. Refer to the Chance...Ch. 12 - Prob. 12.163ACICh. 12 - Prob. 12.164ACICh. 12 - Prob. 12.165ACICh. 12 - Prob. 12.166ACICh. 12 - Sale prices of apartments. A Minneapolis,...Ch. 12 - Volatility of foreign stocks. The relationship...Ch. 12 - Prob. 12.169ACICh. 12 - Prob. 12.170ACICh. 12 - State casket sales restrictions Refer to the...Ch. 12 - Modeling monthly collision claims. A medium-sized...Ch. 12 - Developing a model for college GPA. Many colleges...
Knowledge Booster


Learn more about
Need a deep-dive on the concept behind this application? Look no further. Learn more about this topic, statistics and related others by exploring similar questions and additional content below.Similar questions
- In an attempt to develop a model of wine quality as judged by wine experts, data on alcohol content and wine quality was collected from variants of a particular wine. From a sample of 17 wines, a model was created using the percentages of alcohol to predict wine quality. From the results of that regression, b1=0.4386 and Sb1=0.1141. a. At the 0.05 level of significance, is there evidence of a linear relationship between the percentage of alcohol and wine quality? b. Construct a 95% confidence interval estimate of the population slope, β1. b. The 95% confidence interval is __ ≤ β1 ≤ __ (Round to three decimal places as needed.)arrow_forwardKing & Scott, a research firm for the real estate industry, studied the relation between x=x= annual income (in thousands of dollars) and y=y= sale price of house purchased (in thousands of dollars). A random sample of data was collected from mortgage applications for home sales in the region of the study, and is given in the table. Annual Income House Price 72 188 48 91.6 73 182.2 97 155.5 97 238.8 94 203.4 67 160.1 85 212 64 169 Conduct a linear regression. Use the results to answer the following questions. a. What is the value of the correlation coefficient (round to 3 decimal places)? What does the value tell you about the linear relationship between the annual income and the price of house purchased? Correlation coefficient: This indicates: very weak positive linear correlation fairly strong negative linear correlation perfect positive linear correlation very weak negative linear correlation perfect negative linear correlation no linear…arrow_forwardIs CEO compensation related to a company's performance? To test whether CEO compensation and a company's stock performance are related, a financial analyst collected data on 12 randomly selected, publicly traded companies. For each company, the analyst looked at two variables: the percent change in stock price over the past five years (which she denoted x ) and the percent change in CEO compensation over the past five years (which she denoted y ). For these 12 companies, the least-squares regression equation relating the two variables was =y+−0.1650.046x , and the standard error of the slope of this least-squares regression line was approximately 0.028 . Using her information, test for a significant linear relationship between these two variables by doing a hypothesis test regarding the population slope β1 . (Assume that the variable y follows a normal distribution for each value of x and that the other regression assumptions are satisfied.) Use the…arrow_forward
- The table presents data on the taste test of 38 brands of pinot noir wine [data were first reported in an article by Kwan, Kowalski, and Skogenboe in the Journal Agricultural and Food Chemistry (1979, Vol. 27), the response variable is y = quality, and we want to find the "best" regression equation that relates quality to the other five parametersarrow_forwardWould I use the regression line to predict Y from X ? And what is the pattern of the scatterplot?arrow_forwardThe owner of Original Italian Pizza restaurant chain wants to understand which variable most strongly influences the sales of his specialty deep-dish pizza. He has gathered data on the monthly sales of deep-dish pizzas at his restaurants and observations on other potentially relevant variables for each of several outlets in central Indiana. These data are provided in the file P10_04.xlsx. Estimate a simple linear regression equation between the quantity sold (Y) and each of the following candidates for the best explanatory variable: average price of deep-dish pizzas (X1), monthly advertising expenditures (X2), and disposable income per household in the areas surrounding the outlets (X3). Round your answers for intercept coefficients to the nearest whole number and slope coefficients to two decimal places, if necessary. If your answer is negative number, enter "minus" sign.arrow_forward
- A social scientist collects information about counties in California and finds that the correlation between average income of the county and a rating of healthcare quality in the county is 0.78. A scatterplot of the two variables is football shaped. A particular county has an average income that is 0.4 SDs above the average of all counties. Using regression, we would predict that its healthcare quality is _________ SDs above the average healthcare quality for all counties, and that it is therefore at the _________ percentile of healthcare quality among all counties. Choose the answer below to fill in the two blanks. Group of answer choices 0.31; 24th 0.78; 58th 0.78; 79th 0.31; 62nd PreviousNextarrow_forwardA researcher was investigating variables that might be associated with the academic performance of high school students. The data included the average Math SAS score of all high school seniors in the city that took the exam (labeled as the variable SAT-M), the average number of dollars per pupil spent on education by the city (labeled as the variable $Per Pupil), and the percentage of high school seniors in the city that took the exam (labeled as the variable %Taking). The researcher ran the following multiple linear regression model as SAT-M=Beta0 + Beta1($Per Pupil) + Beta2(%Taking). This model was fit to the data using the method of least-squares, results shown inside of table within photo. If we want to test using ANOVA F-test with hypotheses Ho: Beta1=Beta2=0 versus H1: at least one of the Beta is not 0, what would the value of our F-statistic mean?arrow_forwardThe Pilot Pen Company has decided to use 15 test markets to examine the sensitivity of demand for its new product to various prices, as shown in the following table. Advertising effort was identical in each market. Each market had approximately the same level of business activity and population.a. Using a linear regression model, estimate the demand function for Pilot’s new pen.b. Evaluate this model by computing the coefficient of determination and by performing a t-test of the significance of the price variable.c. What is the price elasticity of demand at a price of 50 cents? TEST MARKET PRICE CHARGED (¢) QUANTITY SOLD(THOUSANDS OF PENS) 1 2 3 4 5 6 7 8 9 10 11 12 13 14 15 50 50 55 55 60 60 65 65 70 70¢ 80 80 90¢ 90 40 20.0 21.0 19.0 19.5 20.5 19.0 16.0 15.0 14.5 15.5 13.0 14.0 11.5 11.0 17.0arrow_forward
- Researchers conducted a study to see if improvement in students' higher-order cognitive skills (HOCS) was related to the students' GPA. Using data collected from 300 business students, the quadratic regression equation, HOCS=−3.44+4.56(GPA)−0.67(GPA)2 was derived, where the dependent variable HOCS measured the improvement in higher-order cognitive skills, with 1 being the lowest improvement in HOCS and 5 being the highest improvement in HOCS. A. Construct a table of predicted HOCS, using GPA equal to 2.0, 2.25, 2.5, ..., 4.0. Round to three decimal places as needed.arrow_forwardThe systolic blood pressure dataset (in the third sheet of the spreadsheet linked above) contains the systolic blood pressure and age of 30 randomly selected patients in a medical facility. What is the equation for the least square regression line where the independent or predictor variable is age and the dependent or response variable is systolic blood pressure? Y=__________ X + ______________ Patient 7 is 67 years old and has a systolic blood pressure of 170 mm Hg. What is the residual? __________ mm Hg Is the actual value above, below, or on the line? What is the interpretation of the residual? (difference in actual &predicated bp, difference in age, the amount of systolic changes)arrow_forwardThe owner of Showtime Movie Theaters, Inc., would like to predict weekly gross revenueas a function of advertising expenditures. Historical data for a sample of eight weeks follow. Weekly GrossRevenue($1000s) Television Advertising($1000s) Newspaper Advertising($1000s) 96 5.0 1.5 90 2.0 2.0 95 4.0 1.5 92 2.5 2.5 95 3.0 3.3 94 3.5 2.3 94 2.5 4.2 94 3.0 2.5 a. Develop an estimated regression equation with the amount of televisionadvertising as the independent variable.b. Develop an estimated regression equation with both television advertising and newspaper advertising as the independent variables. c. Is the estimated regression equation coefficient for television advertisingexpenditures the same in part (a) and in part (b)? Interpret the coefficient in each case. d. Predict weekly gross revenue for a week when $3500 is spent on television advertising and $1800 is spent on newspaper advertising.arrow_forward
arrow_back_ios
SEE MORE QUESTIONS
arrow_forward_ios
Recommended textbooks for you
 MATLAB: An Introduction with ApplicationsStatisticsISBN:9781119256830Author:Amos GilatPublisher:John Wiley & Sons Inc
 Probability and Statistics for Engineering and th...StatisticsISBN:9781305251809Author:Jay L. DevorePublisher:Cengage Learning
 Statistics for The Behavioral Sciences (MindTap C...StatisticsISBN:9781305504912Author:Frederick J Gravetter, Larry B. WallnauPublisher:Cengage Learning
 Elementary Statistics: Picturing the World (7th E...StatisticsISBN:9780134683416Author:Ron Larson, Betsy FarberPublisher:PEARSON
 The Basic Practice of StatisticsStatisticsISBN:9781319042578Author:David S. Moore, William I. Notz, Michael A. FlignerPublisher:W. H. Freeman
 Introduction to the Practice of StatisticsStatisticsISBN:9781319013387Author:David S. Moore, George P. McCabe, Bruce A. CraigPublisher:W. H. Freeman
MATLAB: An Introduction with Applications
Statistics
ISBN:9781119256830
Author:Amos Gilat
Publisher:John Wiley & Sons Inc
Probability and Statistics for Engineering and th...
Statistics
ISBN:9781305251809
Author:Jay L. Devore
Publisher:Cengage Learning
Statistics for The Behavioral Sciences (MindTap C...
Statistics
ISBN:9781305504912
Author:Frederick J Gravetter, Larry B. Wallnau
Publisher:Cengage Learning
Elementary Statistics: Picturing the World (7th E...
Statistics
ISBN:9780134683416
Author:Ron Larson, Betsy Farber
Publisher:PEARSON
The Basic Practice of Statistics
Statistics
ISBN:9781319042578
Author:David S. Moore, William I. Notz, Michael A. Fligner
Publisher:W. H. Freeman
Introduction to the Practice of Statistics
Statistics
ISBN:9781319013387
Author:David S. Moore, George P. McCabe, Bruce A. Craig
Publisher:W. H. Freeman
Correlation Vs Regression: Difference Between them with definition & Comparison Chart; Author: Key Differences;https://www.youtube.com/watch?v=Ou2QGSJVd0U;License: Standard YouTube License, CC-BY
Correlation and Regression: Concepts with Illustrative examples; Author: LEARN & APPLY : Lean and Six Sigma;https://www.youtube.com/watch?v=xTpHD5WLuoA;License: Standard YouTube License, CC-BY