
Videos
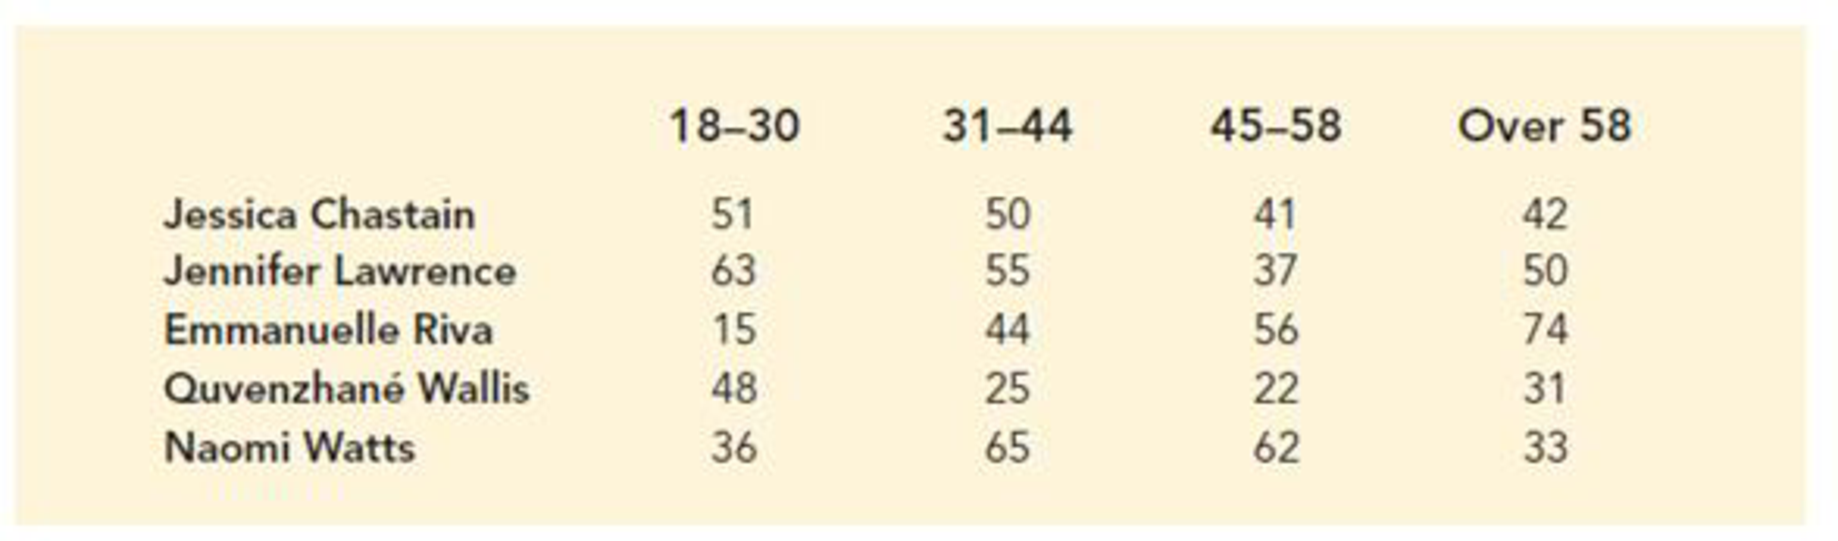
Academy Awards and Movie Fan Sentiment. The race for the 2013 Academy Award for Actress in a Leading Role was extremely tight, featuring several worthy performances. The nominees were Jessica Chastain for Zero Dark Thirty, Jennifer Lawrence for Silver Linings Playbook, Emmanuelle Riva for Amour, Quvenzhané Wallis for Beasts of the Southern Wild, and Naomi Watts for The Impossible. In a survey, movie fans who had seen each of the movies for which these five actresses had been nominated were asked to select the actress who was most deserving of the 2013 Academy Award for Actress in a Leading Role. The responses follow.
- a. How large was the sample in this survey?
- b. Jennifer Lawrence received the 2013 Academy Award for Actress in a Leading Role for her performance in Silver Linings Playbook. Did the respondents favor Ms. Lawrence?
- c. At α = .05, conduct a hypothesis test to determine whether people’s attitude toward the actress who was most deserving of the 2013 Academy Award for Actress in a Leading Role is independent of respondent age. What is your conclusion?
a.
Find the sample size for the given survey.
Answer to Problem 16E
The sample size is 900.
Explanation of Solution
Calculation:
The given observed frequency
| Actress | Age 18-30 | Age 31-44 | Age 45-58 | Age over 58 | Total |
| JC | 51 | 50 | 41 | 42 | 184 |
| JL | 63 | 55 | 37 | 50 | 205 |
| ER | 15 | 44 | 56 | 74 | 189 |
| QW | 48 | 25 | 22 | 31 | 126 |
| NW | 36 | 65 | 62 | 33 | 196 |
| Total | 213 | 239 | 218 | 230 | 900 |
Thus, the sample size is 900.
b.
Explain whether the respondents favor Ms. L.
Explanation of Solution
Calculation:
Actress JL received the 2013 Academy Award for actress in a leading role for movie “SLP”.
The sample proportion of movie fan for Actress JC is,
The sample proportion of movie fan for Actress JL is,
The sample proportion of movie fan for Actress ER is,
The sample proportion of movie fan for Actress QW is,
The sample proportion of movie fan for Actress NW is,
It is clear that, the sample proportion for Actress JL is highest. Thus, the respondents favor Ms. JL. However, Actress JC, Actress ER and Actress NW were also favored by almost same number of fans.
c.
Perform a hypothesis test to determine whether people’s attitude toward the actress who was most deserving of the 2013 Academy Award in a Leading Role, is independent of respondent age at 5% level of significance and draw conclusion of the study.
Answer to Problem 16E
The data provide sufficient evidence to conclude that people’s attitude toward the actress who was most deserving of the 2013 Academy Award in a Leading Role is not independent of respondent age.
Explanation of Solution
Calculation:
State the test hypotheses.
Null hypothesis:
That is, people’s attitude toward the actress who was most deserving of the 2013 Academy Award in a Leading Role is independent of respondent age.
Alternative hypothesis:
That is, people’s attitude toward the actress who was most deserving of the 2013 Academy Award in a Leading Role is not independent of respondent age.
The row and column totals are tabulated below:
| Actress | Age 18-30 | Age 31-44 | Age 45-58 | Age over 58 | Total |
| Actress JC | 51 | 50 | 41 | 42 | 184 |
| Actress JL | 63 | 55 | 37 | 50 | 205 |
| Actress ER | 15 | 44 | 56 | 74 | 189 |
| Actress QW | 48 | 25 | 22 | 31 | 126 |
| Actress NW | 36 | 65 | 62 | 33 | 196 |
| Totals | 213 | 239 | 218 | 230 | 900 |
The formula for expected frequency is given below:
The expected frequency for each category is calculated as follows:
| Actress | Age 18-30 | Age 31-44 | Age 45-58 | Age over 58 |
| Actress JC | ||||
| Actress JL | ||||
| Actress ER | ||||
| Actress QW | ||||
| Actress NW |
The formula for chi-square test statistic is given as,
The value of chi-square test statistic is,
Thus, the chi-square test statistic is 77.74.
Degrees of freedom:
The degrees of freedom are
In the given problem
Therefore,
Level of significance:
The given level of significance is
p-value:
Software procedure:
Step -by-step software procedure to obtain p-value using EXCEL software:
- Open an EXCEL sheet and select cell A1.
- In cell A1 enter the formula =CHISQ.DIST.RT(77.74,12).
- Press Enter.
- Output using EXCEL software is given below:
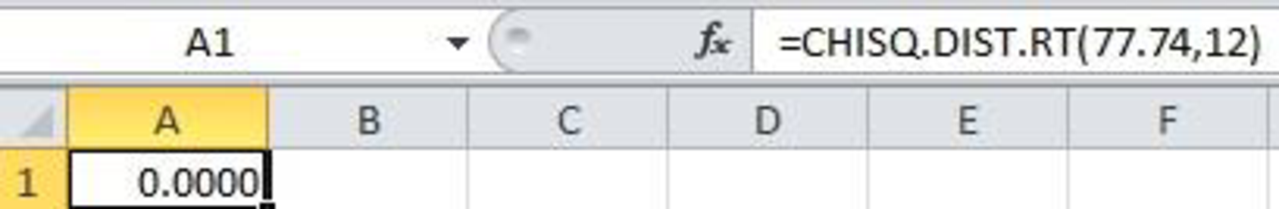
From the EXCEL output, the p-value is 0.
Rejection rule:
- If the
- Otherwise, failed to reject the null hypothesis.
Conclusion:
Here, the p-value is less than the level of significance.
That is,
Thus, the decision is “reject the null hypothesis”.
Therefore, the data provide sufficient evidence to conclude that column variable is not independent of row variable. That is, there is an association between column and row variable.
Thus, the data provide sufficient evidence to conclude that people’s attitude toward the actress who was most deserving of the 2013 Academy Award in a Leading Role is not independent of respondent age.
Want to see more full solutions like this?
Chapter 12 Solutions
MindTap Business Statistics, 1 term (6 months) Printed Access Card for Anderson/Sweeney/Williams/Camm/Cochran's Essentials of Statistics for Business and Economics, 8th


- Debbie Gibson is considering three investment options for a small inheritance that she has just received-stocks, bonds, and money market. The return on her investment will depend on the performance of the economy, which can be strong, average, or weak. If the market is strong her returns are 9% for stocks, 6% for bonds and 4% for money market. If the market is average her returns are 5% for stocks, 4% for bonds and 6% for money market. If the market is weak her returns are -7% for stocks, 2% for bonds and 1% for money market. (Round values to the nearest hundredths of a percent). a) Create a decision table and a decision tree. b) Which investment should Debbie choose if she uses the maximax criterion? What are the returns? c) Which investment should Debbie choose if she uses the maximin criterion? What are the returns?arrow_forwardFrom 1840 to 1850, more than 12,000 pioneers migrated west in wagon trains. It was typically about a 2,000-mile journey, and pioneers averaged about 10 miles per day. One pioneer family, the Smiths, is planning to join a wagon train traveling west to Oregon. The destination is Fort Vancouver, which is near present-day Portland. The family plans to join a wagon train in St. Louis. However, the trains follow various trails west that are mostly determined by the location of forts and trading posts along the way. The Smith family wants to choose a wagon train that will get them to Oregon in the shortest amount of time. They have checked around with the different wagon train leaders plus immigrants, soldiers, fur traders, and scouts who have previously made the trip west, and from the information they have gathered, they have developed the following network, with estimated times (in days) along each branch: a. Determine the shortest route for the Smiths from St. Louis to Ft. Vancouver. b.…arrow_forwardIn her last semester at SPC, Polly Hedron needs to take Statistics, Composition 2, and Ethics. Because Polly is registering early, she has 16 choices for her section of Statistics, 20 choices for her section of Composition, and 11 choices for her section of Ethics. From how many possible schedules can Polly choose? (You may presume that none of these sections interfere with each other)arrow_forward
- On-Time Performance of Airlines. The Bureau of Transportation Statistics reports on-time performance for airlines at major U.S. airports. JetBlue, United, and US Airways share terminal C at Boston’s Logan Airport. Suppose that the percentage of on-time flights reported was 76.8% for JetBlue, 71.5% for United, and 82.2% for US Airways. Assume that 30% of the flights arriving at terminal C are JetBlue flights, 32% are United flights, and 38% are US Airways flights. Develop a joint probability table with three rows (the airlines) and two columns (on-time and late). Answer Let Given: Joint probabilities using the multiplication law With the marginal probabilities , , and given, the joint probability table can then be shown as follows. An announcement is made that Flight 1382 will be arriving at gate 20 of terminal C. What is the probability that Flight 1382 will arrive on time? Answer Using the joint probability table, the probability of an on-time flight is the marginal…arrow_forwardIn a certain company, the salary of men can take the values of 1,000,000, 1,500,000, 2,000,000 and 2,500,000. Women can enjoy the following salaries: 500,000, 1,000,000, 1,500,000 and 2,000,000. Assuming that the percentage of men earning each of the values is the same, and the same relative to women, and that men's wages are independent of women's wages, what is the probability that a couple, chosen at random, together, earn between 2,000,000 and 3,500,000 (included)?arrow_forwardA study of high school juniors in three districts – Belvidere, Rockford, and Byron – was conducted to determine enrollment trends in AP mathematics courses – Calculus or Statistics. 42% of students in the study came from Rockford, 37% from Belvidere, and the rest from Bryon. In Rockford, 64% of the juniors took Statistics and the rest took Calculus. 58% of juniors in Belvidere and 49% of juniors in Byron took Statistics while the rest took Calculus in each district. No juniors took both Statistics and Calculus. a.Describe this situation using a tree diagram. b.Find the probability that a randomly selected student from in the study took Statistics.arrow_forward
- The Southfork Feed Company makes a feed mix from four ingredients--oats, corn, soybeans, and a vitamin supplement. The company has 300 pounds of oats, 400 pounds of corn, 200 pounds of soybeans, and 100 pounds of vitamin supplement available for the mix. The company has the following requirements for the mix:• At least 30% of the mix must be soybeans. • At least 20% of the mix must be the vitamin supplement. e The ratio of corn to oats cannot exceed 2 to 1. •The amount of oats cannot exceed theamount of soybeans. • The mix must be atleast 500 pounds.A pound of oats costs $0.50, a pound of corn, $1.20, a pound of soybeans, $0.60, and a pound of vitamin supplement, $2.00. The feed company wants to know the number of pounds of each ingredient to put in the mix to minimize cost. a. Express constraint of at least 30% of the mix must be soybeans b. Express constraint of at least 20% of the mix must be the vitamin supplement c. Express Constraint of the ratio of corns to oats cannot exceed 2…arrow_forwardEd's Tires and Brakes has two locations, one on the northwest side of town and one on the southeast side of town. At both locations are performed routine tire repairs and rotations, as well as expensive brake repairs. This past week, 80% of the cars serviced at Ed's were serviced at the northwest location, while 20% of the cars were serviced at the southeast location. (No car was serviced at both locations.) Brake repairs were more typical at the northwest location than at the southeast location: 65% of the cars at the northwest location required brake repairs, while 35% of the cars at the southeast location required brake repairs. Let N denote the event that a randomly chosen car (taken to Ed's in the past week) was serviced at the northwest location and N denote the event that a randomly chosen car was serviced at the southeast location. Let B denote the event that a randomly chosen car required brake repairs and B denote the event that a randomly chosen car did not require brake…arrow_forwardThe National Highway Association is studying the relationship between the number of bidders on a highway project and the winning (lowest) bid for the project. Of particular interest is whether the number of bidders increases or decreases the amount of the winning bid. Bidders Price 9.0 5.1 9.0 8.0 3.0 9.7 10.0 7.8 5.0 7.7 10.0 5.5 7.0 8.3 11.0 5.5 6.0 10.3 6.0 8.0 4.0 8.8 7.0 9.4 7.0 8.6 7.0 8.1 6.0 7.8 Given: Correlation of Coefficient: 0.7064 (This is correct) Coefficient of determination: 49.90% (This is correct) ŷ = 11.2360 + (-0.4667)x (This is correct) Create a scatter plot of the data Complete a regression analysis of the relationship. Slope = ______ Estimate the winning bid if there were seven bidders. Winning bid cost ______ millions. Compute the 95% prediction interval for a winning bid if there are seven bidders. [ _____________, ______________]arrow_forward
- The National Highway Association is studying the relationship between the number of bidders on a highway project and the winning (lowest) bid for the project. Of particular interest is whether the number of bidders increases or decreases the amount of the winning bid. Bidders Price 9.0 5.1 9.0 8.0 3.0 9.7 10.0 7.8 5.0 7.7 10.0 5.5 7.0 8.3 11.0 5.5 6.0 10.3 6.0 8.0 4.0 8.8 7.0 9.4 7.0 8.6 7.0 8.1 6.0 7.8 GIVEN: correlation coefficient: - 0.7064 Slope: -0.4667 Coefficient of determination: 49.90% regression equation: ŷ= 11.2360 + (-4467)x FIND: Estimate the winning bid if there were seven bidders. Winning bid cost _________ millions. Explain. Compute the 95% prediction interval for a winning bid if there are seven bidders. [ _______________ , _______________ ] (Explain).arrow_forwardquestion 1 Porshe shoes Store sells a shoes with discounts of 15 percent and 20 percent, while Judy Shoes Store sells the same type of shoes with discounts of 10 percent, 10 percent and 15 percent. (i) Determine which store offers a higher discount.arrow_forwardHow profitable are different sectors of the stock market? One way to answer such a question is to examine profit as a percentage of stockholder equity. A random sample of 32 retail stocks such as Toys 'R' Us, Best Buy, and Gap was studied for x1, profit as a percentage of stockholder equity. The result was x1 = 14.0. A random sample of 36 utility (gas and electric) stocks such as Boston Edison, Wisconsin Energy, and Texas Utilities was studied for x2, profit as a percentage of stockholder equity. The result was x2 = 10.3. Assume that ?1 = 4.5 and ?2 = 3.0. (a) Categorize the problem below according to parameter being estimated, proportion p, mean ?, difference of means ?1 – ?2, or difference of proportions p1 – p2. Then solve the problem. p1 – p2?1 – ?2 ?p (b) Let ?1 represent the population mean profit as a percentage of stockholder equity for retail stocks, and let ?2 represent the population mean profit as a percentage of stockholder equity for utility stocks. Find a 99%…arrow_forward
 MATLAB: An Introduction with ApplicationsStatisticsISBN:9781119256830Author:Amos GilatPublisher:John Wiley & Sons Inc
 Probability and Statistics for Engineering and th...StatisticsISBN:9781305251809Author:Jay L. DevorePublisher:Cengage Learning
 Statistics for The Behavioral Sciences (MindTap C...StatisticsISBN:9781305504912Author:Frederick J Gravetter, Larry B. WallnauPublisher:Cengage Learning
 Elementary Statistics: Picturing the World (7th E...StatisticsISBN:9780134683416Author:Ron Larson, Betsy FarberPublisher:PEARSON
 The Basic Practice of StatisticsStatisticsISBN:9781319042578Author:David S. Moore, William I. Notz, Michael A. FlignerPublisher:W. H. Freeman
 Introduction to the Practice of StatisticsStatisticsISBN:9781319013387Author:David S. Moore, George P. McCabe, Bruce A. CraigPublisher:W. H. Freeman