
Concept explainers
Videos
a.
To state: The hypothesis.
a.
Answer to Problem 15E
The hypothesis for interaction is,
The hypothesis for age of salespersonis,
The hypothesis for product is,
Explanation of Solution
Given info:
The table shows age of the sales representative and type of item affect monthly sales.
Calculation:
The hypothesis for interaction is,
Null hypothesis:
Alternative hypothesis:
The hypothesis for age of salesperson is,
Null hypothesis:
Alternative hypothesis:
The hypothesis for productis,
Null hypothesis:
Alternative hypothesis:
b.
To find: The critical value for each F test.
b.
Answer to Problem 15E
The critical F-value of A is 4.26.
The critical F-value of B and
Explanation of Solution
Given info:
The level of significance is 0.05.
Calculation:
Consider factors A represent the type of paintand B represents the geographic location.
Here,
The formula to find the degrees of freedom for factor A is,
Thus, the degrees of freedom for factor A is1.
Here,
The formula to find the degrees of freedom for factor B is,
Thus, the degrees of freedom for factor B is3.
The formula to find the degrees of freedom for factor
Thus, the degrees of freedom for factor
The degrees of freedom for the within (error) factor
The degrees of freedom for the within (error) factor is 24.
Critical value:
Here A having 1 degrees of freedom and B and
For A:
The critical F-value of A is obtained using the Table H: The F-Distribution with the level of significance
Procedure:
- Locate 24 in the degrees of freedom, denominator row of the Table H.
- Obtain the value in the corresponding degrees of freedom, numerator column below 1.
That is,
Thus, the critical F-value of A is 4.26.
For B and
The critical F-value of B and
Procedure:
- Locate 24 in the degrees of freedom, denominator row of the Table H.
- Obtain the value in the corresponding degrees of freedom, numerator column below 2.
That is,
Thus, the critical F-value of B and
Decision criteria:
If
If
If
c.
To compute: The summary table.
To find: The test value.
c.
Answer to Problem 15E
The summary table is,
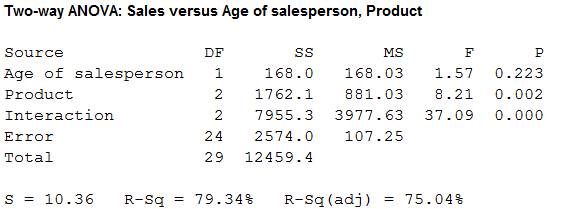
The test valuesare 1.57, 8.21 and 37.09.
Explanation of Solution
Calculation:
Software procedure:
Step-by-step procedure to obtain the test statistics and P-value using the MINITAB software:
- Choose Stat > ANOVA > Two-Way.
- In Response, enter the column of Sales.
- In Row Factor, enter the column of Ages of sales person.
- In Column Factor, enter the column of product.
- Click OK.
Output using the MINITAB software is given below:
From Minitab output, the test valuesare 1.57, 8.21 and 37.09.
d.
To make: The decision.
d.
Answer to Problem 15E
The null hypothesis is rejected for
Explanation of Solution
Conclusion:
From the result of part (c), the
Decision for
Here, the test value of
That is,
Thus, it can be concluding that, the null hypothesis for
Decision for
Here, the test value of
That is,
Thus, it can be concluding that, the null hypothesis for
Decision for
Here, the test value of
That is,
Thus, it can be concluding that, the null hypothesis for
e.
To explain: The results.
e.
Answer to Problem 15E
The result concludes that, there is an interception effect between the ages of salespeople and the type of products sold.
Explanation of Solution
Calculation:
From the results, it can be observed there is a significant between the ages of the sales people and the products they sell on the monthly sales.
Here, the integration effect is between the ages of the sales person and the type of product sold. So, the procedure for drawing the graph for the interaction plot is given below.
Minitab Procedure:
- Choose Stat > ANOVA >Interaction Plot.
- In Response, enter the column of Sales.
- In Factors, enter the column of Ages of sales person and product.
- Click OK.
Output using the MINITAB software is given below:
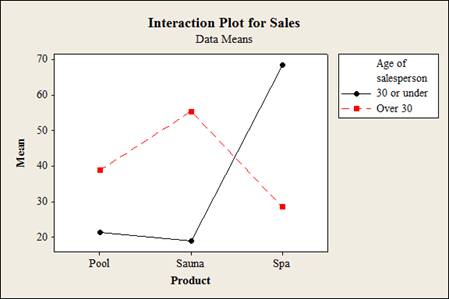
Interpretation:
From the graph, it can be observed that the lines cross. So, the interaction is disordinal interaction. Hence there is an interception effect between the ages of salespeople and the type of products sold.
Want to see more full solutions like this?
Chapter 12 Solutions
ELEMENTARY STATISTICS W/CONNECT >IP<


 Glencoe Algebra 1, Student Edition, 9780079039897...AlgebraISBN:9780079039897Author:CarterPublisher:McGraw Hill