
Videos
Oil Imports from Mexico Daily oil production in Mexico and daily U.S. oil imports from Mexico during 2009–2013 can be approximated by
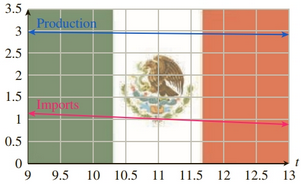
Graph the function
(A) the percentage of oil produced in Mexico that was exported to the United States was decreasing.
(B) the percentage of oil produced in Mexico that was not exported to the United States was increasing.
(C) the percentage of oil produced in Mexico that was exported to the United States was decreasing at a slower rate.
(D) the percentage of oil produced in Mexico that was exported to the United States was decreasing at a faster rate.

Trending nowThis is a popular solution!

Chapter 12 Solutions
Finite Mathematics and Applied Calculus (MindTap Course List)


- Water Flea F. E Smith has reported on population growth of the water flea. In one experiment, he found that the time t, in days, required to reach a population of N is given by the relation e0.44t=NN0(228N0228N)4.46. Here N0 is the initial population size. If the initial population size is 50, how long is required for the population to grow to 125?arrow_forwardThe population Pinmillions of Texas from 2001 through 2014 can be approximated by the model P=20.913e0.0184t, where t represents the year, with t=1 corresponding to 2001. According to this model, when will the population reach 32 million?arrow_forward
 Algebra & Trigonometry with Analytic GeometryAlgebraISBN:9781133382119Author:SwokowskiPublisher:Cengage
 Functions and Change: A Modeling Approach to Coll...AlgebraISBN:9781337111348Author:Bruce Crauder, Benny Evans, Alan NoellPublisher:Cengage Learning
 Trigonometry (MindTap Course List)TrigonometryISBN:9781337278461Author:Ron LarsonPublisher:Cengage Learning
 College AlgebraAlgebraISBN:9781305115545Author:James Stewart, Lothar Redlin, Saleem WatsonPublisher:Cengage Learning