Concept explainers
Videos
(a)
To find: the independent variable and the dependent variable.
(a)
Answer to Problem 12.13E
The variable API is the response variable (y) or the dependent variable and the variable ELL is the predictor variable (x) or independent variable.
Explanation of Solution
Given:
| School |
|
|
|
|
|
|
|
|
| API | ||||||||
| EL |
Calculation:
From the given data,
The variable API is the response variable (y) or the dependent variable and the variable ELL is the predictor variable (x) or independent variable. Because, the Academic performance index (API) depends upon English language learner (ELL). Based on English language learner (ELL), we can measure Academic performance index (API).
Conclusion: The variable API is the response variable (y) or the dependent variable and the variable ELL is the predictor variable (x) or independent variable.
(b)
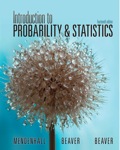
To plot:the given data using the
(b)
Answer to Problem 12.13E
The assumptions of a linear relationship between x and y are reasonable.
Explanation of Solution
Given:
| School |
|
|
|
|
|
|
|
|
| API | ||||||||
| EL |
Calculation:
The assumptions of a linear relationship between x and y are reasonable because there is no strong curvature present in the scatterplot.
Conclusion: Therefore, the assumptions of a linear relationship between x and y are reasonable.
(c)
To calculate: the least-squares regression line.
(c)
Answer to Problem 12.13E
The least squares regression line is
Explanation of Solution
Given:
| School |
|
|
|
|
|
|
|
|
| API | ||||||||
| EL |
Calculation:
Calculation for the data in first two columns of the table is:
| API(y) | ELL(x) |
|
|
|
The sum of squares are,
The slope is,
The mean is the sum of all values divided by the number of values.
The estimate
The least squares regression line is:
Conclusion: Thus, the least squares regression line is
(d)
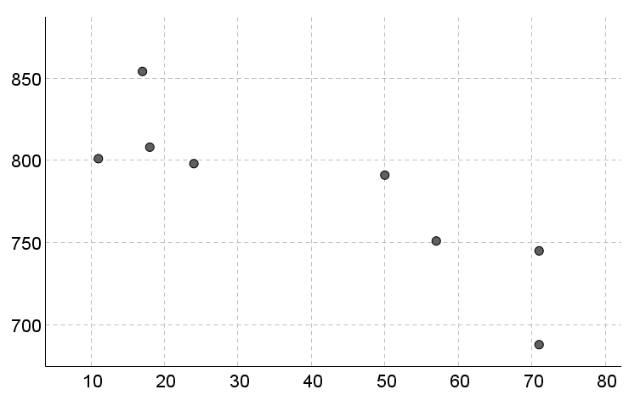
To plot:the line on the scatterplot in part b and explain whether the line fits the data points.
(d)
Answer to Problem 12.13E
The line fits through the data points.
Explanation of Solution
Given:
| School |
|
|
|
|
|
|
|
|
| API | ||||||||
| EL |
Calculation:
We plot the line on the scatter plot in the part (b):
The line fits through the data points. Since, there is equal deviation from the fitted line.
Conclusion: The line fits through the data points.
Want to see more full solutions like this?
Chapter 12 Solutions
EBK INTRODUCTION TO PROBABILITY AND STA


 Linear Algebra: A Modern IntroductionAlgebraISBN:9781285463247Author:David PoolePublisher:Cengage Learning
 Big Ideas Math A Bridge To Success Algebra 1: Stu...AlgebraISBN:9781680331141Author:HOUGHTON MIFFLIN HARCOURTPublisher:Houghton Mifflin Harcourt
 Glencoe Algebra 1, Student Edition, 9780079039897...AlgebraISBN:9780079039897Author:CarterPublisher:McGraw Hill
 Holt Mcdougal Larson Pre-algebra: Student Edition...AlgebraISBN:9780547587776Author:HOLT MCDOUGALPublisher:HOLT MCDOUGAL