Videos
a)
To construct a
a)
Explanation of Solution
Given:
The data is,
| Student | Posttest | Final Exam |
| 1 | 100 | 98 |
| 2 | 96 | 97 |
| 3 | 88 | 88 |
| 4 | 100 | 100 |
| 5 | 100 | 100 |
| 6 | 96 | 78 |
| 7 | 80 | 68 |
| 8 | 68 | 47 |
| 9 | 92 | 90 |
| 10 | 96 | 94 |
| 11 | 88 | 84 |
| 12 | 92 | 93 |
| 13 | 68 | 57 |
| 14 | 84 | 84 |
| 15 | 84 | 81 |
| 16 | 88 | 83 |
| 17 | 72 | 84 |
| 18 | 88 | 93 |
| 19 | 72 | 57 |
| 20 | 88 | 83 |
Calculation:
Following is the scatter plot:
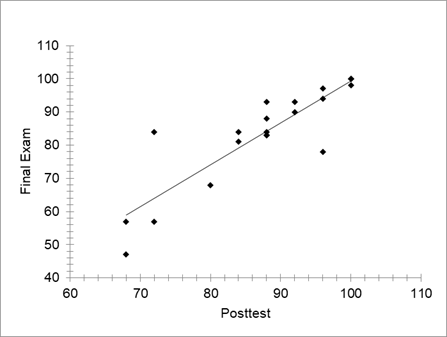
The assumption of linearity holds in the scatter plot.
b)
To find regression equation.
b)
Answer to Problem 12.28E
Explanation of Solution
Given:
The data is,
| Student | Posttest | Final Exam |
| 1 | 100 | 98 |
| 2 | 96 | 97 |
| 3 | 88 | 88 |
| 4 | 100 | 100 |
| 5 | 100 | 100 |
| 6 | 96 | 78 |
| 7 | 80 | 68 |
| 8 | 68 | 47 |
| 9 | 92 | 90 |
| 10 | 96 | 94 |
| 11 | 88 | 84 |
| 12 | 92 | 93 |
| 13 | 68 | 57 |
| 14 | 84 | 84 |
| 15 | 84 | 81 |
| 16 | 88 | 83 |
| 17 | 72 | 84 |
| 18 | 88 | 93 |
| 19 | 72 | 57 |
| 20 | 88 | 83 |
Calculation:
Using excel,
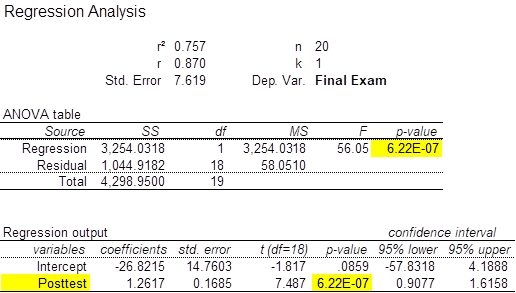
The regression equation is,
c)
To explain if data present sufficient evidence to indicate that final exam score is linearly related to the posttest score.
c)
Answer to Problem 12.28E
Data present sufficient evidence to indicate that final exam score is linearly related to the posttest score.
Explanation of Solution
Given:
The data is,
| Student | Posttest | Final Exam |
| 1 | 100 | 98 |
| 2 | 96 | 97 |
| 3 | 88 | 88 |
| 4 | 100 | 100 |
| 5 | 100 | 100 |
| 6 | 96 | 78 |
| 7 | 80 | 68 |
| 8 | 68 | 47 |
| 9 | 92 | 90 |
| 10 | 96 | 94 |
| 11 | 88 | 84 |
| 12 | 92 | 93 |
| 13 | 68 | 57 |
| 14 | 84 | 84 |
| 15 | 84 | 81 |
| 16 | 88 | 83 |
| 17 | 72 | 84 |
| 18 | 88 | 93 |
| 19 | 72 | 57 |
| 20 | 88 | 83 |
Calculation:
Using excel,

The p-value = 6.22E-07 < 0.05 hence rejecting null hypothesis. Hence, data present sufficient evidence to indicate that final exam score is linearly related to the posttest score.
d)
To find the 99% confidence interval for slope of the regression equation.
d)
Answer to Problem 12.28E
the 99% confidence interval for slope of the regression equation= (0.7767,1.7468)
Explanation of Solution
Given:
The data is,
| Student | Posttest | Final Exam |
| 1 | 100 | 98 |
| 2 | 96 | 97 |
| 3 | 88 | 88 |
| 4 | 100 | 100 |
| 5 | 100 | 100 |
| 6 | 96 | 78 |
| 7 | 80 | 68 |
| 8 | 68 | 47 |
| 9 | 92 | 90 |
| 10 | 96 | 94 |
| 11 | 88 | 84 |
| 12 | 92 | 93 |
| 13 | 68 | 57 |
| 14 | 84 | 84 |
| 15 | 84 | 81 |
| 16 | 88 | 83 |
| 17 | 72 | 84 |
| 18 | 88 | 93 |
| 19 | 72 | 57 |
| 20 | 88 | 83 |
Calculation:
Using excel,
| Regression output | confidence interval | |||||
| variables | coefficients | std. error | t (df=18) | p-value | 99% lower | 99% upper |
| Intercept | -26.8215 | 14.7603 | -1.817 | .0859 | -69.3083 | 15.6652 |
| Posttest | 1.2617 | 0.1685 | 7.487 | 6.22E-07 | 0.7767 | 1.7468 |
Confidence interval = (0.7767,1.7468)
Want to see more full solutions like this?
Chapter 12 Solutions
EBK INTRODUCTION TO PROBABILITY AND STA


- Urban Travel Times Population of cities and driving times are related, as shown in the accompanying table, which shows the 1960 population N, in thousands, for several cities, together with the average time T, in minutes, sent by residents driving to work. City Population N Driving time T Los Angeles 6489 16.8 Pittsburgh 1804 12.6 Washington 1808 14.3 Hutchinson 38 6.1 Nashville 347 10.8 Tallahassee 48 7.3 An analysis of these data, along with data from 17 other cities in the United States and Canada, led to a power model of average driving time as a function of population. a Construct a power model of driving time in minutes as a function of population measured in thousands b Is average driving time in Pittsburgh more or less than would be expected from its population? c If you wish to move to a smaller city to reduce your average driving time to work by 25, how much smaller should the city be?arrow_forwardWhat is meant by the sample space of an experiment?arrow_forward
 Glencoe Algebra 1, Student Edition, 9780079039897...AlgebraISBN:9780079039897Author:CarterPublisher:McGraw Hill
 Functions and Change: A Modeling Approach to Coll...AlgebraISBN:9781337111348Author:Bruce Crauder, Benny Evans, Alan NoellPublisher:Cengage Learning
 Holt Mcdougal Larson Pre-algebra: Student Edition...AlgebraISBN:9780547587776Author:HOLT MCDOUGALPublisher:HOLT MCDOUGAL
 College Algebra (MindTap Course List)AlgebraISBN:9781305652231Author:R. David Gustafson, Jeff HughesPublisher:Cengage Learning