
Introduction to Probability and Statistics
14th Edition
ISBN: 9781133103752
Author: Mendenhall, William
Publisher: Cengage Learning
expand_more
expand_more
format_list_bulleted
Concept explainers
Videos
Textbook Question
Chapter 12.7, Problem 12.40E
Refer to Exercise 12.7. Portions of the MINITAB printout are shown here.
MINITAB Output for Exercise 12.40
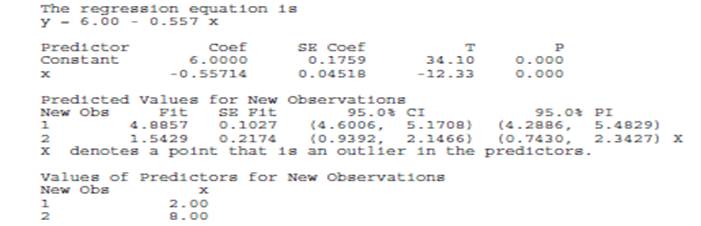
- Find a 95% confidence interval for the average value of y when
- Find a 95% prediction interval for some value of ‘‘to be observed in the future when
- The last line in the third section of the printoutindicates a problem with one of the fitted values.
What value of x corresponds to the fitted value
Expert Solution & Answer
Want to see the full answer?
Check out a sample textbook solution
Students have asked these similar questions
In exercise 12, the following data on x = average daily hotel room rate and y = amount spent on entertainment (The Wall Street Journal, August 18, 2011) lead to the estimated regression equation ŷ = 17.49 + 1.0334x. For these data SSE = 1541.4.Click on the datafile logo to reference the data. Use Table 1 of Appendix B.
a. Predict the amount spent on entertainment for a particular city that has a daily room rate of $89 (to 2 decimals).$
b. Develop a 95% confidence interval for the mean amount spent on entertainment for all cities that have a daily room rate of $89 (to 2 decimals).$ to $
c. The average room rate in Chicago is $128. Develop a 95% prediction interval for the amount spent on entertainment in Chicago (to 2 decimals).
In exercise 12, the following data on x = average daily hotel room rate and y = amount spent on entertainment (The Wall Street Journal, August 18, 2011) lead to the estimated regression equation ŷ = 17.49 + 1.0334x. For these data SSE = 1541.4. Use Table 1 of Appendix B.Click on the datafile logo to reference the data.
a. Predict the amount spent on entertainment for a particular city that has a daily room rate of $89 (to 2 decimals).$
b. Develop a 95% confidence interval for the mean amount spent on entertainment for all cities that have a daily room rate of $89 (to 2 decimals).$ to $
c. The average room rate in Chicago is $128. Develop a 95% prediction interval for the amount spent on entertainment in Chicago (to 2 decimals).$ to $
In simple linear regression, at what value of the independent variable, X, will the 95% confidence interval for the average value of Y be narrowest? At what value will the 95% prediction interval for the value of Y for a single n ew observation be narrowest?
Chapter 12 Solutions
Introduction to Probability and Statistics
Ch. 12.4 - Prob. 12.1ECh. 12.4 - Prob. 12.2ECh. 12.4 - Prob. 12.3ECh. 12.4 - Prob. 12.4ECh. 12.4 - Prob. 12.5ECh. 12.4 - You are given five points with these coordinates:...Ch. 12.4 - Prob. 12.7ECh. 12.4 - Prob. 12.8ECh. 12.4 - Prob. 12.9ECh. 12.4 - Prob. 12.10E
Ch. 12.4 - Prob. 12.11ECh. 12.4 - Prob. 12.12ECh. 12.4 - Prob. 12.13ECh. 12.4 - Prob. 12.14ECh. 12.4 - Prob. 12.15ECh. 12.4 - Prob. 12.16ECh. 12.4 - Prob. 12.17ECh. 12.5 - Prob. 12.19ECh. 12.5 - Prob. 12.20ECh. 12.5 - Prob. 12.21ECh. 12.5 - Prob. 12.22ECh. 12.5 - Prob. 12.23ECh. 12.5 - Prob. 12.24ECh. 12.5 - Professor Asimov, continued Refer to thedata in...Ch. 12.5 - Prob. 12.26ECh. 12.5 - Prob. 12.27ECh. 12.5 - Prob. 12.28ECh. 12.5 - Prob. 12.29ECh. 12.5 - Prob. 12.30ECh. 12.6 - Prob. 12.34ECh. 12.6 - Prob. 12.35ECh. 12.6 - Prob. 12.36ECh. 12.6 - Prob. 12.37ECh. 12.6 - Prob. 12.38ECh. 12.7 - Refer to Exercise 12.7. Portions of the MINITAB...Ch. 12.7 - Prob. 12.41ECh. 12.7 - Prob. 12.42ECh. 12.7 - Prob. 12.43ECh. 12.7 - Prob. 12.44ECh. 12.7 - Prob. 12.45ECh. 12.7 - Prob. 12.46ECh. 12.8 - Prob. 12.50ECh. 12.8 - Prob. 12.51ECh. 12.8 - Prob. 12.52ECh. 12.8 - Prob. 12.53ECh. 12.8 - Prob. 12.55ECh. 12.8 - Prob. 12.56ECh. 12.8 - Prob. 12.58ECh. 12.8 - Baseball Stats Does a team’s batting average...Ch. 12 - Prob. 12.62SECh. 12 - Prob. 12.63SECh. 12 - Prob. 12.65SECh. 12 - Prob. 12.66SECh. 12 - Prob. 12.67SECh. 12 - Tennis, Anyone? If you play tennis, you know that...Ch. 12 - Prob. 12.69SECh. 12 - Prob. 12.70SECh. 12 - Prob. 12.71SECh. 12 - Movie Reviews How many weeks cana movie run and...Ch. 12 - In addition to increasingly large bounds onerror,...Ch. 12 - Prob. 12.74SECh. 12 - Prob. 12.76SECh. 12 - Prob. 1CSCh. 12 - Prob. 2CSCh. 12 - Prob. 3CS
Knowledge Booster


Learn more about
Need a deep-dive on the concept behind this application? Look no further. Learn more about this topic, statistics and related others by exploring similar questions and additional content below.Similar questions
- A researcher developed a regression model to predict the cost of a meal based on the summated rating (sum of ratings for food, decor,and service) and the cost per meal for 12 restaurants. The results of the study show that b1=1.4379 and Sb1=0.1397. a. At the 0.05 level of significance, is there evidence of a linear relationship between the summated rating of a restaurant and the cost of a meal? b. Construct a 95% confidence interval estimate of the population slope, β1. a. Determine the hypotheses for the test. Choose the correct answer below. A. H0: β1=0 H1: β1≠0 B. H0: β0≤0 H1: β0>0 C. H0: β1≤0 H1: β1>0 D. H0: β0≥0 H1: β0<0 E. H0: β1≥0 H1: β1<0 F. H0: β0=0 H1: β0≠0 Compute the test statistic. The test statistic is ? (Round to two decimal places as needed.) Determine the critical value(s). The critical value(s) is(are) ? (Use a comma to separate answers as needed.…arrow_forwardA teacher conducted a regression analysis to investigate the relationship between student height and femur length. Computer output from the linear regression analysis is shown in the table. The analysis was performed on a sample of 24 students. Term CoefCoef SE CoefSE Coef Constant 28.34 0.945 Femur length 1.73 0.023 Assume that the conditions for inference for the slope of the regression equation have been met. Which of the following defines the margin of error for a 99.5 percent confidence interval for the slope of the least-squares regression equation? A)3.104 (0.023) B)3.104 (1.73) C)3.119 (0.023) D)3.119(0.945) E)3.119(1.73)arrow_forwardRefer to 9.3.4 below and Let X = 1.6 and construct the 95 percent confidence interval for μy|x and construct the 95 percent prediction interval for Y. 9.3.4 Reiss et al. (A-3) compared point-of-care and standard hospital laboratory assays for monitoring patients receiving a single anticoagulant or a regimen consisting of a combination of anticoagulants. It is quite common when comparing two measuring techniques, to use regression analysis in which one variable is used to predict another. In the present study, the researchers obtained measures of international normalized ratio (INR) by assay of capillary and venous blood samples collected from 90 subjects taking warfarin. INR, used especially when patients are receiving warfarin, measures the clotting ability of the blood. Point-of-care testing for INR was conducted with the CoaguChek assay product. Hospital testing was done with standard hospital laboratory assays. The authors used the hospital assay INR level to predict the CoaguChek…arrow_forward
- Use the following information from a multiple regression analysis. n=15 b1=2 b2=6 Sb1=1.4 Sb2=0.5 a. Which variable has the largest slope, in units of a t statistic? b. Construct a 90% confidence interval estimate of the population slope, β1. c. At the 0.10 level of significance, determine whether each independent variable makes a significant contribution to the regression model. On the basis of these results, indicate the independent variables to include in this model.arrow_forwardWhich of the following would NOT be the problems if near multicollinearity is present but ignored? Select one: a. The regression ‘looks bad’ as a whole, but the individual variables are significant. b. The confidence intervals for the parameters will be very wide, and significance tests might, therefore, give inappropriate conclusions. c. R2 will be high, but the individual coefficients will have high standard errors. d. The regression becomes very sensitive to small changes in the specification.arrow_forwardA linear regression model was fit to a set of data containing 18 observations. The computer output of the regression analysis is shown in the table. Term CoefCoef SE CoefSE Coef TT Constant 12.00 5.43 2.210 xx 0.694 0.241 2.880 Assume the conditions for regression are met. Which of the following defines the margin of error when a 95 percent confidence interval for the slope of the least-squares regression line is calculated? (1.75)(0.241) A (1.75)(0.694) B (1.96)(0.241) C (2.12)(0.241)) D (2.12)(0.694) Earrow_forward
- Given below are seven observations collected in a regression study on two variables, x (independent variable) and y (dependent variable). Copy and paste the numbers in an Excel worksheet and then use Excel's Regression tool to conduct a simple linear regression analysis. Choose 95% confidence level. Answer the following questions: x y 2 12 3 9 6 8 7 7 8 6 7 5 9 2 t statistics is statistically significant at 5% level. Answer Yes or No. Yes No What is the lower bound of the 95% confidence interval for the independent variable x (Keep 2 decimal places) What is the upper bound of the 95% confidence interval for the independent variable x (Keep 2 decimal places)arrow_forwardWhich of the following is assumed for establishing the unbiassedness of Ordinary Least Square(OLS) estimates? A) The sample value outcomes on the explanatory variable are all the same value B)The error term has the same variance given any value of the explanatory variable. C)The error term has an expected value of 1 given any value of the explanatory variable D) The regression equation is linear in the explained and explanatory variables.arrow_forwardThe sample observation below were randomly selected. (a) Determine the regression equation, (b) Determine the expected value of Y if X=9, (c) Determine the 0.90 confidence interval for the mean predicted when X=9, and (d) Determine the 0.90 prediction interval for an individual predicted when X=9. x 4,5,3,6,10 y 4 6 5 7 7arrow_forward
- An analyst has used a sample of 100 observations to create a regression equation with one independent variable. The intercept coefficient is 2.1 with a standard error of 0.4. and the slope coefficient for the variance of the prediction error is 9. If the value of the independent variable is 5.0, the prediction interval for the dependent variable at a 95% confidence level is closest to? Is it? A. 1.1 to 37.1 B. 13.1 to 25.1 C. 14.2 to 24.0arrow_forwardWhich of the following can cause OLS estimators to be biased?(i) Heteroskedasticity.(ii) Omitting an important variable.(iii) A sample correlation coefficient of .95 between two independent variables both included in the model.arrow_forwardBased on the sample data set: (0,0) ( 2,3) (3,3) (6,4) (9,8) A. Construct the 90% confidence interval for the slope B1 of the population regression line B. find the Coefficient of determination using the formula r2=B1SSxy / SSyy.arrow_forward
arrow_back_ios
SEE MORE QUESTIONS
arrow_forward_ios
Recommended textbooks for you
 MATLAB: An Introduction with ApplicationsStatisticsISBN:9781119256830Author:Amos GilatPublisher:John Wiley & Sons Inc
 Probability and Statistics for Engineering and th...StatisticsISBN:9781305251809Author:Jay L. DevorePublisher:Cengage Learning
 Statistics for The Behavioral Sciences (MindTap C...StatisticsISBN:9781305504912Author:Frederick J Gravetter, Larry B. WallnauPublisher:Cengage Learning
 Elementary Statistics: Picturing the World (7th E...StatisticsISBN:9780134683416Author:Ron Larson, Betsy FarberPublisher:PEARSON
 The Basic Practice of StatisticsStatisticsISBN:9781319042578Author:David S. Moore, William I. Notz, Michael A. FlignerPublisher:W. H. Freeman
 Introduction to the Practice of StatisticsStatisticsISBN:9781319013387Author:David S. Moore, George P. McCabe, Bruce A. CraigPublisher:W. H. Freeman
MATLAB: An Introduction with Applications
Statistics
ISBN:9781119256830
Author:Amos Gilat
Publisher:John Wiley & Sons Inc
Probability and Statistics for Engineering and th...
Statistics
ISBN:9781305251809
Author:Jay L. Devore
Publisher:Cengage Learning
Statistics for The Behavioral Sciences (MindTap C...
Statistics
ISBN:9781305504912
Author:Frederick J Gravetter, Larry B. Wallnau
Publisher:Cengage Learning
Elementary Statistics: Picturing the World (7th E...
Statistics
ISBN:9780134683416
Author:Ron Larson, Betsy Farber
Publisher:PEARSON
The Basic Practice of Statistics
Statistics
ISBN:9781319042578
Author:David S. Moore, William I. Notz, Michael A. Fligner
Publisher:W. H. Freeman
Introduction to the Practice of Statistics
Statistics
ISBN:9781319013387
Author:David S. Moore, George P. McCabe, Bruce A. Craig
Publisher:W. H. Freeman
Correlation Vs Regression: Difference Between them with definition & Comparison Chart; Author: Key Differences;https://www.youtube.com/watch?v=Ou2QGSJVd0U;License: Standard YouTube License, CC-BY
Correlation and Regression: Concepts with Illustrative examples; Author: LEARN & APPLY : Lean and Six Sigma;https://www.youtube.com/watch?v=xTpHD5WLuoA;License: Standard YouTube License, CC-BY