Videos
Suppose that each firm in a competitive industry has the following costs:
Total cost: TC = 50 + ½ q2
Marginal cost: MC = q
where q is an individual firm’s quantity produced.
The market
Demand: QD = 120 − P
where P is the
a. What is each firm’s fixed cost? What is its variable cost? Give the equation for average total cost.
b. Graph
c Give the equation for each firm’s supply curve.
d. Give the equation for the market supply curve for the short run in which the number of firms is fixed.
e. What is the
f. In this equilibrium, how much does each firm produce? Calculate each firm’s profit or loss. Is there incentive for firms to enter or exit?
g. In the long run with free entry and exit, what is the equilibrium price and quantity in this market?
h. In this long-run equilibrium, how much does each firm produce? How many firms are in the market?
Subpart (a):
Calculate average total cost.
Explanation of Solution
The total cost equation, marginal cost equation and demand equation are given below:
The fixed cost and variable cost of each firm are determined from Equation (1). Here, the fixed cost is a part of the total cost and will not change in response to a change in quantity. The variable cost is a part of the total cost and it changes in response to a change in quantity. So, the fixed cost is $50 and the variable cost is
Average total cost equation is represented below:
Or
Concept introduction:
Average total cost: The average total cost is the total cost per unit of the output produced by a firm.
Subpart (b):
Draw average total cost curve.
Explanation of Solution
Figure 1 represents the average total cost curve and marginal cost curve.
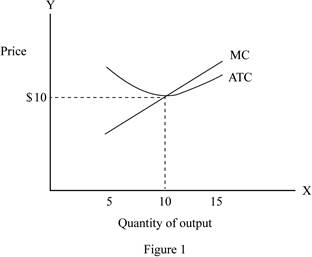
From the above figure, the x-axis shows the quantity of the output and the y-axis shows the price level.
From the graph, the average total cost is at its minimum, when they produce 10 units of output. The average total cost and marginal cost are at the quantity of 10 units of output.
Concept introduction:
Average total cost: The average total cost is the total cost per unit of the output produced by a firm.
Subpart (c):
Supply curve.
Explanation of Solution
In the perfect competition, the supply curve is even, as the marginal cost curve is beyond the intersecting point of the average total cost curve.
Supply curve for each firm is shown below:
Concept introduction:
Marginal cost curve: The marginal cost is the additional cost incurred on the additional production and its curve is U-shaped, which represents the combination of price level and quantity of output.
Subpart (d):
Quantity supply.
Explanation of Solution
In the short-run, there are currently 9 firms. So, the market supply curve is determined by using the following formula:
Hence, the short-run market supply curve is shown below:
Concept introduction:
Supply: Supply refers to the total value of the goods and services that are available for the purchase at a particular price in a given period of time.
Subpart (e):
Equilibrium price and quantity.
Explanation of Solution
The equilibrium quantity and price are determined by using the following formula:
Substitute the respective values in Equation (8) to calculate the equilibrium quantity and price.
Thus, the equilibrium price is $12.
Substitute the price of $12 in Equation (3) to calculate the equilibrium quantity.
Thus, the equilibrium quantity is 108 units.
Concept introduction:
Equilibrium price: It is the price at which the quantity demanded of a good or service is equal to the quantity supplied.
Equilibrium: It is the market price and quantity determined by equating the supply to the demand. At this equilibrium point, the supply will be equal to the demand and there will be no excess demand or supply in the economy. Thus, the economy will be at equilibrium.
Subpart (f):
Calculate profit.
Explanation of Solution
In the short-run equilibrium, each firm produces 12 units
Profit can be calculated by using the following formula:
Substitute the respective values in Equation (9) to calculate the profit.
Thus, the profit is $22.
Since the firms have positive value in making profit, there will be a benefit for the firm entering the market.
Concept introduction:
Profit: Profit refers to the excess revenue after subtracting the total cost from the total revenue.
Subpart (g):
Equilibrium quantity.
Explanation of Solution
In the long-run, the firm earns zero economic profit, so the price is equal to the minimum average total cost. Since the average total cost is $10, the equilibrium price is also be $10.
Equilibrium quantity can be determined by using Equation (3), when the equilibrium price is $10.
Thus, the long-run equilibrium quantity is 110.
Concept introduction:
Equilibrium: It is the market price and quantity determined by equating the supply to the demand. At this equilibrium point, the supply will be equal to the demand and there will be no excess demand or supply in the economy. Thus, the economy will be at equilibrium.
Subpart (h):
Number of firms in the long run.
Explanation of Solution
In the long-run, the firm produces 10 units of output. This is because in the long-run, the production price of the firm is equal to the minimum average total cost. The average total cost is 10 units. Also, there are 11 firms
Long run: Thelong run refers to the time, which changes the production variable to adjust to the market situation.
Want to see more full solutions like this?
Chapter 13 Solutions
Essentials of Economics - LMS Aplia


- Suppose that the development of a new drought-resistant hybrid seed corn leads to a 50 percent increase in the average yield per acre without increasing the cost to the farmers who use the new technology. If the producers in the corn production industry were price takers, what would happen to the following? a. the price of corn b. the profitability of corn farmers who quickly adopt the new technology c. the profitability of corn farmers who are slow to adopt the new technology d. the price of soybeans, a substitute product for cornarrow_forwardSuppose that each firm in a competitive industry has the following costs: Total cost: TC = 50 + 1/2q2 Marginal cost: MC = q Where q is an individual firm’s quantity produced. The market demand curve for the product is: Demand: QD = 120 – P Where P is the price and Q is the total quantity of the good. Currently there are 9 firms in the market. What is each firm’s fixed cost? What is its variable cost? Give the equation for average total cost. Graph the average-total-cost curve and the marginal-cost curve for q from 5 to 15. At what quantity is the average-total-cost curve at its minimum? What is the marginal cost and average total cost at that quantity? Give the equation for each firm’s supply curve. Give the equation for the market supply curve for the short run in which the number of firms is fixed. What is the equilibrium price and quantity for the market in the short run? In this equilibrium, how much does each firm produce? Calculate the firm’s profit and loss. Do firms have…arrow_forwardFirms in the market for soccer balls are selling in a purely competitive market. A firm in the soccer ball market has an output of 5,000 balls, which it sells for $10 each. At the output level of 5,000 the average variable cost is $6.00, the average total cost is $7.50, and the marginal cost is $10.00. What would you expect the firm to do in the short run? Why? What would you expect the market to do in the long run? Why?arrow_forward
- The market for fertilizer is perfectly competitive. Firms in the market are producing output but are currently making economic losses. Which of the following statements is true about the price of fertilizer? Check all that apply. The price of fertilizer must be less than average total cost. The price of fertilizer must be equal to average variable cost. The price of fertilizer must be less than marginal cost. Assuming there is no change in either demand or the firm's cost curves, which of the following statements is true about what will happen in the long run? Check all that apply. Average total cost will decrease. The quantity supplied by each firm will decrease. The total quantity supplied to the market will decrease. Marginal cost will decrease. The price of fertilizer will increase.arrow_forwardSuppose the competitive market price is $60, and a competitive firm’s total costs = q^2 - 6q + 990 and marginal cost = 2q - 6. a. Solve for the profit-maximizing (or loss minimizing) quantity (q*). b. What is the market equilibrium price? c. Should the competitive firm produce q*? Explain why using one of the four key questions and solutions. d. Does the competitive firm make a profit? Explain why using one of the four key questions and solutions. e. How much profit (or loss) does the competitive firm make?arrow_forward

 Microeconomics: Private and Public Choice (MindTa...EconomicsISBN:9781305506893Author:James D. Gwartney, Richard L. Stroup, Russell S. Sobel, David A. MacphersonPublisher:Cengage Learning
 Economics: Private and Public Choice (MindTap Cou...EconomicsISBN:9781305506725Author:James D. Gwartney, Richard L. Stroup, Russell S. Sobel, David A. MacphersonPublisher:Cengage Learning
 Economics (MindTap Course List)EconomicsISBN:9781337617383Author:Roger A. ArnoldPublisher:Cengage Learning
 Exploring EconomicsEconomicsISBN:9781544336329Author:Robert L. SextonPublisher:SAGE Publications, Inc