
ALEKS 360 BLUMAN ELE.STAT:A STEP.(11WKS)
10th Edition
ISBN: 9781260041842
Author: Bluman
Publisher: MCG CUSTOM
expand_more
expand_more
format_list_bulleted
Concept explainers
Videos
Textbook Question
Chapter 13, Problem 17CQ
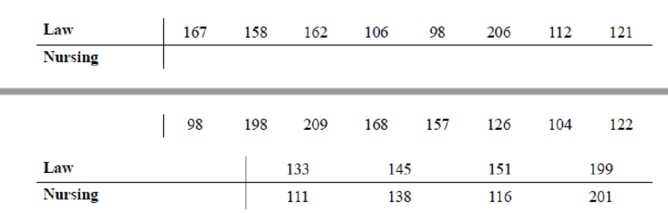
Textbook Costs Samples of students majoring in law and nursing are randomly selected, and the amount each spent on textbooks for the spring semester is recorded here, in dollars. Using the Wilcoxon rank sum test at α = 0.10, is there a difference in the amount spent by each group?
Expert Solution & Answer
Want to see the full answer?
Check out a sample textbook solution
Students have asked these similar questions
An appliance store receives a shipment of 30 microwave ovens, 5 of which are (unknown
to the manager) defective. The store manager selects 4 ovens at random, without
replacement, and tests to see if they are defective. Let X = number of defectives
found. Calculate the pmf and cdf of X and plot the cdf.
%3D
An engineer decides to test four plate materials at three temperature levels (15, 70, and 125°F).
Three batteries are tested at each combination of plate material and temperature. The experiment:
and the resulting observed battery life data (in hours) are given in the following table.
Scientists have discovered a new bird species; however, they only found 15 birds of such species. They measured the height (in cm) of these 10 birds:12.94, 5.80, 15.47, 14.14, 7.48, 9.21, 9.79, 8.86, 17.75, 10.39. I entered the data into R as shown below:
bird <- c(12.94, 5.80, 15.47, 14.14, 7.48, 9.21, 9.79, 8.86, 17.75, 10.39)
Treat this data as population data. Which of the following R code computes the variance of the height of the birds?
A.
var(bird)
B.
sum((bird - mean(bird))^2)/length(bird)
C.
mean((bird - mean(bird))^2)
D.
sum((bird - mean(bird))^2)/9
E.
B and C
F.
A and D
G.
B and D
H.
A and C
Chapter 13 Solutions
ALEKS 360 BLUMAN ELE.STAT:A STEP.(11WKS)
Ch. 13.1 - The following table lists the percentages of...Ch. 13.1 - Exercises 131 1. What is meant by nonparametric...Ch. 13.1 - When should nonparametric statistics be used?Ch. 13.1 - Prob. 3ECh. 13.1 - List the disadvantages of nonparametric...Ch. 13.1 - Prob. 5ECh. 13.1 - Explain what is meant by the efficiency of a...Ch. 13.1 - Prob. 7ECh. 13.1 - For Exercises 7 through 12, rank each set of data....Ch. 13.1 - For Exercises 7 through 12, rank each set of data....
Ch. 13.1 - Prob. 10ECh. 13.1 - Prob. 11ECh. 13.1 - Prob. 12ECh. 13.2 - Clean Air An environmentalist suggests that the...Ch. 13.2 - Exercises 132 1. Why is the sign test the simplest...Ch. 13.2 - Prob. 2ECh. 13.2 - Prob. 3ECh. 13.2 - Prob. 4ECh. 13.2 - For Exercises 5 through 20, perform these steps....Ch. 13.2 - Prob. 6ECh. 13.2 - AID: 1825 | 12/01/2018 7. Annual Incomes for Men...Ch. 13.2 - Weekly Earnings of Women According to the Womens...Ch. 13.2 - Externships Fifty undergraduate students were...Ch. 13.2 - Lottery Ticket Sales A lottery outlet owner...Ch. 13.2 - Prob. 11ECh. 13.2 - Deaths due to Severe Weather A meteorologist...Ch. 13.2 - Prob. 13ECh. 13.2 - Television Viewers A researcher read that the...Ch. 13.2 - Prob. 15ECh. 13.2 - Exam Scores A statistics professor wants to...Ch. 13.2 - Prob. 17ECh. 13.2 - Effects of a Pill on Appetite A researcher wishes...Ch. 13.2 - Prob. 19ECh. 13.2 - Routine Maintenance and Defective Parts A...Ch. 13.2 - Prob. 21ECCh. 13.2 - Prob. 22ECCh. 13.2 - Prob. 23ECCh. 13.2 - 1, 8, 2, 6, 10, 15, 24, 33, 56, 41, 58, 54, 5, 3,...Ch. 13.2 - Prob. 25ECCh. 13.3 - School Lunch A nutritionist decided to see if...Ch. 13.3 - Prob. 1ECh. 13.3 - What is the parametric equivalent test for the...Ch. 13.3 - Prob. 3ECh. 13.3 - Lengths of Prison Sentences A random sample of men...Ch. 13.3 - Prob. 5ECh. 13.3 - Lifetimes of Handheld Video Games To test the...Ch. 13.3 - Prob. 7ECh. 13.3 - Winning Baseball Games For the years 19701993 the...Ch. 13.3 - Prob. 9ECh. 13.3 - Medical School Enrollments Random samples of...Ch. 13.3 - Prob. 11ECh. 13.3 - Student Participation in a Blood Drive Students in...Ch. 13.4 - Pain Medication A researcher decides to see how...Ch. 13.4 - Prob. 1ECh. 13.4 - Prob. 2ECh. 13.4 - Prob. 3ECh. 13.4 - For Exercises 3 and 4, find the sum of the signed...Ch. 13.4 - Prob. 5ECh. 13.4 - Prob. 6ECh. 13.4 - Prob. 7ECh. 13.4 - Prob. 8ECh. 13.4 - Prob. 9ECh. 13.4 - For Exercises 914, use the Wilcoxon signed-rank...Ch. 13.4 - Prob. 11ECh. 13.4 - For Exercises 914, use the Wilcoxon signed-rank...Ch. 13.4 - Prob. 13ECh. 13.4 - For Exercises 914, use the Wilcoxon signed-rank...Ch. 13.5 - Prob. 1ACCh. 13.5 - Prob. 1ECh. 13.5 - For Exercises 1 through 12, use the Kruskal-Wallis...Ch. 13.5 - Prob. 3ECh. 13.5 - For Exercises 1 through 12, use the Kruskal-Wallis...Ch. 13.5 - Prob. 5ECh. 13.5 - For Exercises 1 through 12, use the Kruskal-Wallis...Ch. 13.5 - Prob. 7ECh. 13.5 - For Exercises 1 through 12, use the Kruskal-Wallis...Ch. 13.5 - Prob. 9ECh. 13.5 - For Exercises 1 through 12, use the Kruskal-Wallis...Ch. 13.5 - Prob. 11ECh. 13.5 - For Exercises 1 through 12, use the Kruskal-Wallis...Ch. 13.6 - Tall Trees As a biologist, you wish to see if...Ch. 13.6 - Prob. 1ECh. 13.6 - Prob. 2ECh. 13.6 - Prob. 3ECh. 13.6 - Prob. 4ECh. 13.6 - Prob. 5ECh. 13.6 - For Exercises 5 through 14, perform these steps....Ch. 13.6 - Prob. 7ECh. 13.6 - For Exercises 5 through 14, perform these steps....Ch. 13.6 - Prob. 9ECh. 13.6 - Prob. 10ECh. 13.6 - Prob. 11ECh. 13.6 - For Exercises 5 through 14, perform these steps....Ch. 13.6 - Prob. 13ECh. 13.6 - For Exercises 5 through 14, perform these steps....Ch. 13.6 - Prob. 15ECh. 13.6 - Daily Lottery Numbers Listed below are the daily...Ch. 13.6 - Prob. 17ECh. 13.6 - Random Numbers Random? A calculator generated...Ch. 13.6 - Prob. 19ECh. 13.6 - Gender of Shoppers Twenty shoppers are in a...Ch. 13.6 - Employee Absences A supervisor records the number...Ch. 13.6 - Skiing Conditions A ski lodge manager observes the...Ch. 13.6 - Prob. 23ECh. 13.6 - Prob. 25ECh. 13.6 - Speeding Tickets A police chief records the gender...Ch. 13.6 - Prob. 27ECh. 13.6 - Prob. 28ECh. 13.6 - Prob. 29ECCh. 13.6 - Prob. 30ECCh. 13.6 - Prob. 31ECCh. 13.6 - Prob. 32ECCh. 13.6 - Prob. 33ECCh. 13 - For Exercises 1 through 13, follow this procedure:...Ch. 13 - Prob. 13.2.2RECh. 13 - Prob. 13.2.3RECh. 13 - Record High Temperatures Shown here are the record...Ch. 13 - Hours Worked by Student Employees Student...Ch. 13 - Prob. 13.4.6RECh. 13 - Prob. 13.4.7RECh. 13 - Prob. 13.5.8RECh. 13 - Prob. 13.5.9RECh. 13 - Prob. 13.6.10RECh. 13 - Prob. 13.6.11RECh. 13 - NBA Scoring Leaders The scoring leaders for the...Ch. 13 - Prob. 13.6.13RECh. 13 - Prob. 13.6.14RECh. 13 - Prob. 1DACh. 13 - Prob. 2DACh. 13 - Prob. 3DACh. 13 - Determine whether each statement is true or false....Ch. 13 - Prob. 2CQCh. 13 - Determine whether each statement is true or false....Ch. 13 - Determine whether each statement is true or false....Ch. 13 - Prob. 5CQCh. 13 - Prob. 6CQCh. 13 - Prob. 7CQCh. 13 - Prob. 8CQCh. 13 - Prob. 9CQCh. 13 - Prob. 10CQCh. 13 - Prob. 11CQCh. 13 - Complete the following statements with the best...Ch. 13 - Prob. 13CQCh. 13 - Prob. 14CQCh. 13 - Prob. 15CQCh. 13 - Prob. 16CQCh. 13 - Textbook Costs Samples of students majoring in law...Ch. 13 - Prob. 18CQCh. 13 - Prob. 19CQCh. 13 - Prob. 20CQCh. 13 - Prob. 21CQCh. 13 - Prob. 22CQCh. 13 - Prob. 23CQCh. 13 - Prob. 24CQCh. 13 - Prob. 25CQCh. 13 - Prob. 26CQ
Additional Math Textbook Solutions
Find more solutions based on key concepts
Use the following information to answer the next 14 exercises: The mean age for all Foothill College students f...
Introductory Statistics
Medication Usage In a survey of 3005 adults aged 57 through 85 years, it was found that 82% of them used at lea...
Statistical Reasoning for Everyday Life (5th Edition)
A father rates his daughter as a 2 on a 7-point scale (from 1 to 7) of crankiness. In this example, (a) what is...
Statistics for Psychology
Provide an example of a qualitative variable and an example of a quantitative variable.
Elementary Statistics (Text Only)
A simple random sample of 200 third-graders in a large school district was chosen to participate in an after-sc...
Essential Statistics
In Hamilton County, Ohio, the mean number of days needed to sell a house is 86 days (Cincinnati Multiple Listin...
STATISTICS F/BUSINESS+ECONOMICS-TEXT
Knowledge Booster


Learn more about
Need a deep-dive on the concept behind this application? Look no further. Learn more about this topic, statistics and related others by exploring similar questions and additional content below.Similar questions
- Find the mean hourly cost when the cell phone described above is used for 240 minutes.arrow_forwardFind the intensities of earthquakes whose magnitudes are (a) R=6.0 and (b) R=7.9.arrow_forwardUrban Travel Times Population of cities and driving times are related, as shown in the accompanying table, which shows the 1960 population N, in thousands, for several cities, together with the average time T, in minutes, sent by residents driving to work. City Population N Driving time T Los Angeles 6489 16.8 Pittsburgh 1804 12.6 Washington 1808 14.3 Hutchinson 38 6.1 Nashville 347 10.8 Tallahassee 48 7.3 An analysis of these data, along with data from 17 other cities in the United States and Canada, led to a power model of average driving time as a function of population. a Construct a power model of driving time in minutes as a function of population measured in thousands b Is average driving time in Pittsburgh more or less than would be expected from its population? c If you wish to move to a smaller city to reduce your average driving time to work by 25, how much smaller should the city be?arrow_forward
- According to a census company, 7.1% of all babies born are of low birth weight. An obstetrician wanted to know whether mothers between the ages of 35 and 39 years give birth to a higher percentage of low-birth-weight babies. She randomly selected 240 births for which the mother was 35 to 39 years old and found 26 low-birth-weight babies. Complete parts (a) through (c) below. Họ: 0.071 Hy: 0.071 Use technology to compute the P-value for this test. Use the Tech Help button for further assistance. P-value = (Round to three decimal places as needed.) State a conclusion for this test in the context of the obstetrician's question. Choose the correct answer below. O A. Do not reject the null hypothesis. There is sufficient evidence to conclude that mothers between the ages of 35 and 39 years give birth to a higher percentage of low-birth-weight babies at the a = 0.05 level of significance. B. Reject the null hypothesis. There is sufficient evidence to conclude that mothers between the ages of…arrow_forwardPlease solve for G, H, and Iarrow_forwardNeed help asap!! Thanks!arrow_forward
- The data on the right represent the number of live multiple-delivery births (three or more babies) in a particular year for women 15 to 54 years old. Use the data to complete Number of Multiple parts (a) through (d) below. Age 15-19 Births 89 20-24 515 25-29 1628 30-34 2837 35-39 40-44 1849 373 45-54 118 (a) Delemne une provavmy uiat a Tanuomy seiecieu muupie DiruTIOr WUmen TO-04 years uiu nvoiveu a IOuier JU U 39 years OIu. P(30 to 39) = 1 (Type an integer or decimal rounded to three decimal places as needed.) (b) Determine the probability that a randomly selected multiple birth for women 15-54 years old involved a mother who was not 30 to 39 years old. P(not 30 to 39) = (Type an integer or decimal rounded to three decimal places as needed.) (c) Determine the probability that a randomly selected multiple birth for women 15-54 years old involved a mother who was less than 45 years old. P(less than 45) = (Type an integer or decimal rounded to three decimal places as needed.)arrow_forwardFor Numbers 21 to 25: Capsaicin content in red habanero chilli (Capsicum chinense Jacq.) is affected by the drying process. An experiment was conducted to determine the effect of using different drying temperatures (60 °C, 70 °C, and 80 °C) using an oven. Samples of red habanero chilli were procured. Upon checking, there were varying sizes of chilli and thus the experimenter grouped the samples according to size. Drying temperatures were then randomly assigned within each group for 8 hours. The capsaicin content was measured for each sample. The partial analysis of variance table is shown below: Source of Variation Fc p-value Size Temperature 2.1654 0.1560 8.6013 0.0034 21. The experimental design of the study is . A. one-way treatment structure in RCBD B. one-way treatment structure in LSD C. two-way treatment structure in RCBD D. two-way treatment structure in LSDarrow_forwardA sample of blood pressure measurements is taken for a group of adults, and those values (mm Hg) are listed below. The values are matched so that 10 subjects each have a systolic and diastolic measurement. Find the coefficient of variation for each of the two samples; then compare the variation. Systolic Diastolic116 78129 75160 7596 53157 90124 86114 60136 66128 74121 83arrow_forward
- For numbers 18 to 21: A study was conducted using 50 undergraduates at a large private university who volunteered to participate in the research as partial fulfillment of a course requirement. One of the items studi ed was the maximum daly amount of alcohol consumed in the last month. Base on the datain the following table, are there differen ces between males and females in the maximum amount of alcohol consumedin any one day in the pastmonth? Use 5% level of significance. Assume equal variances. Male 8.2 female 5.6 5.7 30 Alcohol consumed Mean Standard deviation Number of students 5.9 20 18. Which of thefollowing is the appropriate altemative hypothesis? A There are more female participants than males B. The amount of alcohol consumed by males is higherthan the amount consumed by the females. C The amount of alcohol consumed by males and females in the past month is not the same. D. The amount of alcohol consumed by males and females in the past month is the same. 19. The pooled…arrow_forwardA certain virus affects 0.5% of the population. A test used to detect the virus in a person is positive 90% of the time if the person has the virus (true positive) and 15% of the time if the person does not have the virus (false positive). Fill out the remainder of the following table and use it to answer the two questions below based on a total sample of 100,000 people. Virus No Virus Total Positive Test Negative Test Total 100,000 a) Find the probability that a person has the virus given that they have tested positive. Round your answer to the nearest hundredth of a percent and do not include a percent sign. % b) Find the probability that a person does not have the virus given that they test negative. Round your answer to the nearest hundredth of a percent and do not include a percent sign.arrow_forwardWhat is the test statistics? From the problem in the picturearrow_forward
arrow_back_ios
arrow_forward_ios
Recommended textbooks for you

 Trigonometry (MindTap Course List)TrigonometryISBN:9781337278461Author:Ron LarsonPublisher:Cengage Learning
 Glencoe Algebra 1, Student Edition, 9780079039897...AlgebraISBN:9780079039897Author:CarterPublisher:McGraw Hill
 Functions and Change: A Modeling Approach to Coll...AlgebraISBN:9781337111348Author:Bruce Crauder, Benny Evans, Alan NoellPublisher:Cengage Learning
 College Algebra (MindTap Course List)AlgebraISBN:9781305652231Author:R. David Gustafson, Jeff HughesPublisher:Cengage Learning
 Mathematics For Machine TechnologyAdvanced MathISBN:9781337798310Author:Peterson, John.Publisher:Cengage Learning,
Trigonometry (MindTap Course List)
Trigonometry
ISBN:9781337278461
Author:Ron Larson
Publisher:Cengage Learning
Glencoe Algebra 1, Student Edition, 9780079039897...
Algebra
ISBN:9780079039897
Author:Carter
Publisher:McGraw Hill
Functions and Change: A Modeling Approach to Coll...
Algebra
ISBN:9781337111348
Author:Bruce Crauder, Benny Evans, Alan Noell
Publisher:Cengage Learning
College Algebra (MindTap Course List)
Algebra
ISBN:9781305652231
Author:R. David Gustafson, Jeff Hughes
Publisher:Cengage Learning
Mathematics For Machine Technology
Advanced Math
ISBN:9781337798310
Author:Peterson, John.
Publisher:Cengage Learning,
Hypothesis Testing - Solving Problems With Proportions; Author: The Organic Chemistry Tutor;https://www.youtube.com/watch?v=76VruarGn2Q;License: Standard YouTube License, CC-BY
Hypothesis Testing and Confidence Intervals (FRM Part 1 – Book 2 – Chapter 5); Author: Analystprep;https://www.youtube.com/watch?v=vth3yZIUlGQ;License: Standard YouTube License, CC-BY