
a:
Calculate the z value and p value with boys.
a:
Explanation of Solution
The null hypothesis (H0) is
The calculated Z value and p value can be obtained using the statistical software. The result is given below:
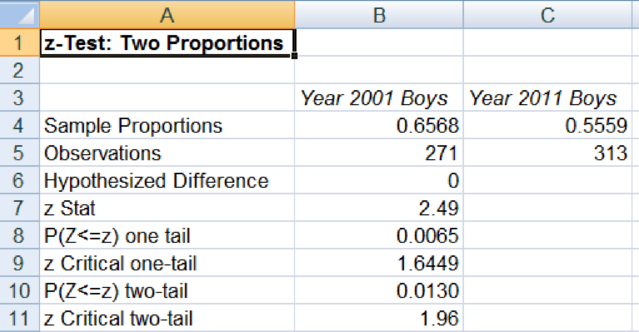
The Z value is 2.49 and the p value is 0.0065. Since the p value is nearly equal to 0, the alternate hypothesis is accepted.
b:
Calculate the z value and p value with girls.
b:
Explanation of Solution
The null hypothesis (H0) is
The calculated Z value and p value can be obtained using the statistical software. The result is given below:
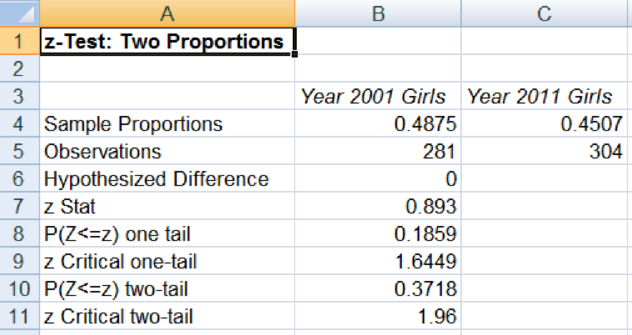
The Z value is 0.893 and the p value is 0.1859. Since the p value is significantly different from 0, the alternate hypothesis is not accepted.
c:
Calculate the z value and p value with boys and girls.
c:
Explanation of Solution
The null hypothesis (H0) is
The calculated Z value and p value can be obtained using the statistical software. The result is given below:
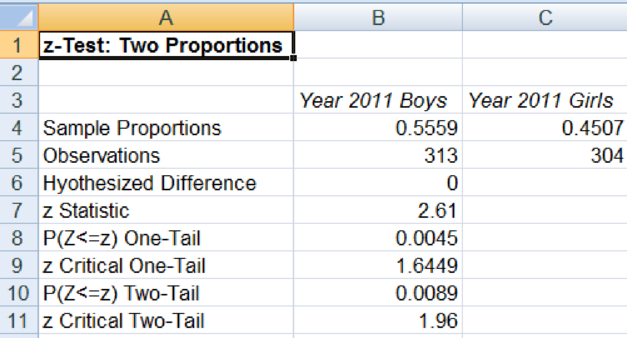
The Z value is 2.61 and the p value is 0.0045. Since the p value is nearly equal to 0, the alternate hypothesis is accepted.
Want to see more full solutions like this?
Chapter 13 Solutions
EBK STATISTICS FOR MANAGEMENT AND ECONO

- Question: In two large populations, there are 30 and 25 per cent respectively of blue-eyed people. Is this difference likely to be hidden in samples of 1,200 and 900 respectively from the two populations ?arrow_forwardBenson Manufacturing is considering ordering electronic components from three different suppliers. The suppliers may differ in terms of quality in that the proportion or percentage of defective components may differ among the suppliers. To evaluate the proportion of defective components for the suppliers, Benson has requested a sample shipment of 500 components from each supplier. The number of defective components and the number of good components found in each shipment are as follows. Supplier Component Defective 17 22 42 Good 483 478 458 (a) Formulate the hypotheses that can be used to test for equal proportions of defective components provided by the three suppliers. OH PA PB = Pc 0 H: All population proportions are not equal. OH PA = P₁ = Pc H: Not all population proportions are equal. OH: All population proportions are not equal. H₂PAP=Pc OH,: Not all population proportions are equal. H₂: PA=PB = Pc (b) Using a 0.05 level of significance, conduct the hypothesis test. Find the…arrow_forwardPrevious answer was poorly formatedarrow_forward
- CASE 2 (continued) In a completely randomized experimental design, 11 experimental units were used for each of the 3 treatments. Part of the ANOVA table is shown below. ANOVA Source of Variation SS Between Groups Within Groups Total 1500 6000 df I? 32 MS F ? Fill in the blanks in the above ANOVA table.At 95% confidence, test to determine whether or not the means of the 3 populations are equal. Find MSE. MSE isarrow_forwardA company launched a sales campaign and appointed 110 salesmen for this purpose. At the end of the period the sales results were analysed and the following information was obtained. Sales ('000 Number of Salesmen Sales ('000- Number of Salesmen 4 50-55 55-60 75-80 18 7 80-85 12 60-65 10 85-90 10 65-70 20 90 and above 5 70-75 22 It was decided to group the salesm into three categories: (i) Those whose sales were less than dollar 68,000, (ii) those whose sales were more than Dollar 68,000, but less t han dollar 86,000, and (iii) those w hose sales exceeded Dollar 86,000. The salesmen in the first category were to be given further training an d those in the third category to be given efficiency bonus of 2% of thei r sales. Find how many will be train and how much bonus will be pai d ? State the assumptions, if any.arrow_forwardBirth weight and smoking during pregnancy,Birthweight,Smoker3771,03140,03317,04210,03076,03771,03487,03487,01559,03630,03572,03260,03430,04224,02955,03912,03196,03459,03459,03430,02750,03686,03260,03969,03430,03629,02863,02830,03105,02948,03175,04309,03232,03487,02807,03820,03941,02211,03204,03657,13487,12495,14253,13147,13600,13005,12552,13147,14593,13430,11985,13317,13487,13884,13289,13470,12665,13090,12835,11843,14451,12863,1900,12353,13317,12850,13560,13080,12325,13119,13175,13313,13374,12750,12835,13345,12637,13742,13119,13345,13175,12013,13232,13286,13360,13402,12948,12580,13260,13686,12750,12977,12580,14082,12807,12381,13175,13714,13544,13544,1arrow_forward
- An economist collects data regarding the number of jobs an individual has held by age 21. Tim states he had 4 jobs, Sam had 3, Jill had 3, Sally had 2, and Watney had 10.An economist should use the to draw conclusions. A typical individual had jobs by the age 21.arrow_forwardMany parents allow underage children to drink alcohol in limited situations when an adult is present to supervise. The idea is that teens will learn responsible drinking habits if they first experience alcohol in a controlled environment. Other parents take a strict no-drinking approach. Researchers surveyed a sample of 200 students aged 14 to 17, about their alcohol use and about alcohol related problems. Using a=0.05, answer the questions No Alcohol related Problems Alcohol Related Problems Not allowed to drink 71 9 80 Allowed to drink 89 31 |120 160 40 N=200 What is the alternative hypothesis? [ Select] What is the null hypothesis? [ Select] What inferential test is being conducted? [ Select] What is the obtained statistic? [ Select ] What determines the critical value? [ Select ] What is the critical value? [ Select ] What is the decision rule? [ Select] What is your decision? [ Select] What is your conclusion? [ Select ]arrow_forwardpls provide a short answer atleast 3 sentences!!! thank you!!!arrow_forward
- 7. Some years ago, a new brand of toothpaste was introduced in the United States. According to its advertisements, studies showed that it had "considerable success" in improving the health of a person's teeth. Suppose that these studies were designed in the following way. The manufacturer of this toothpaste chose three samples of seven people; the first sample agreed to use the new brand, the second sample used Brand A, and the third sample used Brand B. After six months, a dentist examined each person's teeth and scored the health of his or her teeth on a scale of 0 (lowest possible score) to 100 (highest possible score). The results were as follows: New Brand Brand A Brand B 65 58 54 71 60 38 53 63 43 55 90 61 34 95 94 82 89 96 77 62 82 The manufacturer of the new toothpaste says that the average score for the new brand is 2 points higher than for Brand A and 4 points higher than for Brand B. Would you agree with the manufacturer's advertisements? Explain.arrow_forwardResearchers conducted a prospective cohort study to assess the association between dietary supplements and cognitive ability among children. A total of 500 children age 12-17 years who take an omega-3 fatty acid supplement are compared with 500 children age 12-17 years who do not take an omega-3 fatty acid supplement. Researchers follow the children for 2 years. During this time, 300 children who take the supplement earn what is classified as a “high” score on a cognitive test while 200 children who do not take the supplement earn what is classified as a “high” score on the same cognitive test. Show calculations. a) Construct a 2x2 table from the information presented above b) The risk difference is:arrow_forward16. A movie producer is bringing out a new movie, In order to map out his advertising, he wants to determine whether the movie will appeal most to a particular age group or whether it will appeal equally to all age groups. The producer takes a random sample from persons attending a pre-reviewing showing of the new movie and obtains the following result. Use x'-test to derive the conclusion, Age-groups Persons Under-20 20-39 40-59 60 and over Total Liked the movie 110 200 710 320 80 Disliked the movie 70 60 195 50 15 Indifferent 30 20 40 95 Total 400 100 200 300 1,000arrow_forward

 Principles of Economics (12th Edition)EconomicsISBN:9780134078779Author:Karl E. Case, Ray C. Fair, Sharon E. OsterPublisher:PEARSON
 Engineering Economy (17th Edition)EconomicsISBN:9780134870069Author:William G. Sullivan, Elin M. Wicks, C. Patrick KoellingPublisher:PEARSON
 Principles of Economics (MindTap Course List)EconomicsISBN:9781305585126Author:N. Gregory MankiwPublisher:Cengage Learning
 Managerial Economics: A Problem Solving ApproachEconomicsISBN:9781337106665Author:Luke M. Froeb, Brian T. McCann, Michael R. Ward, Mike ShorPublisher:Cengage Learning
 Managerial Economics & Business Strategy (Mcgraw-...EconomicsISBN:9781259290619Author:Michael Baye, Jeff PrincePublisher:McGraw-Hill Education