
Videos
CASE PROBLEM 1: WENTWORTH MEDICAL CENTER
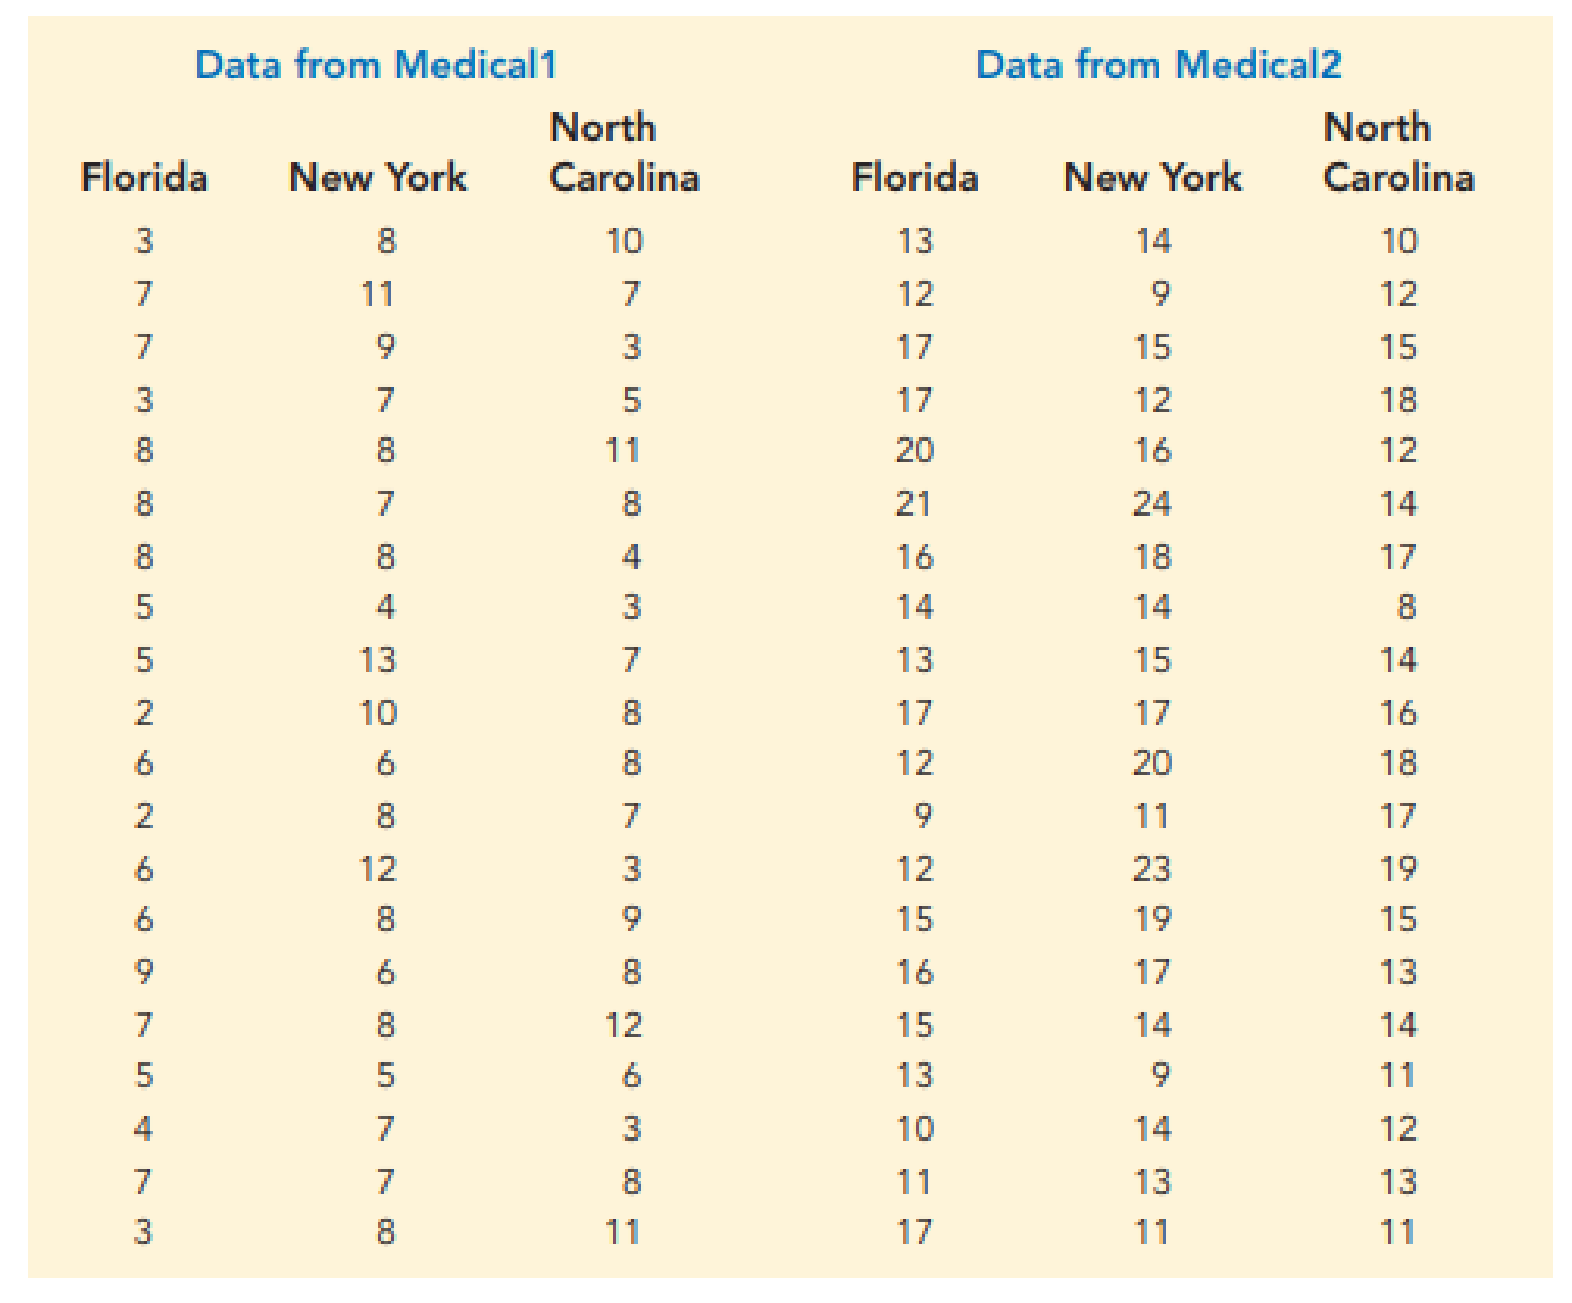
As part of a long-term study of individuals 65 years of age or older, sociologists and physicians at the Wentworth Medical Center in upstate New York investigated the relationship between geographic location and depression. A sample of 60 individuals, all in reasonably good health, was selected; 20 individuals were residents of Florida, 20 were residents of New York, and 20 were residents of North Carolina. Each of the individuals sampled was given a standardized test to measure depression. The data collected follow; higher test scores indicate higher levels of depression. These data are contained in the file Medical1.
A second part of the study considered the relationship between geographic location and depression for individuals 65 years of age or older who had a chronic health condition such as arthritis, hypertension, and/or heart ailment. A sample of 60 individuals with such conditions was identified. Again, 20 were residents of Florida, 20 were residents of New York, and 20 were residents of North Carolina. The levels of depression recorded for this study follow. These data are contained in the file named Medical2.
Managerial Report
- 1. Use
descriptive statistics to summarize the data from the two studies. What are your preliminary observations about the depression scores? - 2. Use analysis of variance on both data sets. State the hypotheses being tested in each case. What are your conclusions?
- 3. Use inferences about individual treatment means where appropriate. What are your conclusions?
Want to see the full answer?
Check out a sample textbook solution
Chapter 13 Solutions
Modern Business Statistics with Microsoft Excel (MindTap Course List)


 MATLAB: An Introduction with ApplicationsStatisticsISBN:9781119256830Author:Amos GilatPublisher:John Wiley & Sons Inc
 Probability and Statistics for Engineering and th...StatisticsISBN:9781305251809Author:Jay L. DevorePublisher:Cengage Learning
 Statistics for The Behavioral Sciences (MindTap C...StatisticsISBN:9781305504912Author:Frederick J Gravetter, Larry B. WallnauPublisher:Cengage Learning
 Elementary Statistics: Picturing the World (7th E...StatisticsISBN:9780134683416Author:Ron Larson, Betsy FarberPublisher:PEARSON
 The Basic Practice of StatisticsStatisticsISBN:9781319042578Author:David S. Moore, William I. Notz, Michael A. FlignerPublisher:W. H. Freeman
 Introduction to the Practice of StatisticsStatisticsISBN:9781319013387Author:David S. Moore, George P. McCabe, Bruce A. CraigPublisher:W. H. Freeman