
Modern Business Statistics with Microsoft Excel (MindTap Course List)
5th Edition
ISBN: 9781285433301
Author: David R. Anderson, Dennis J. Sweeney, Thomas A. Williams
Publisher: Cengage Learning
expand_more
expand_more
format_list_bulleted
Videos
Textbook Question
Chapter 13.5, Problem 31E
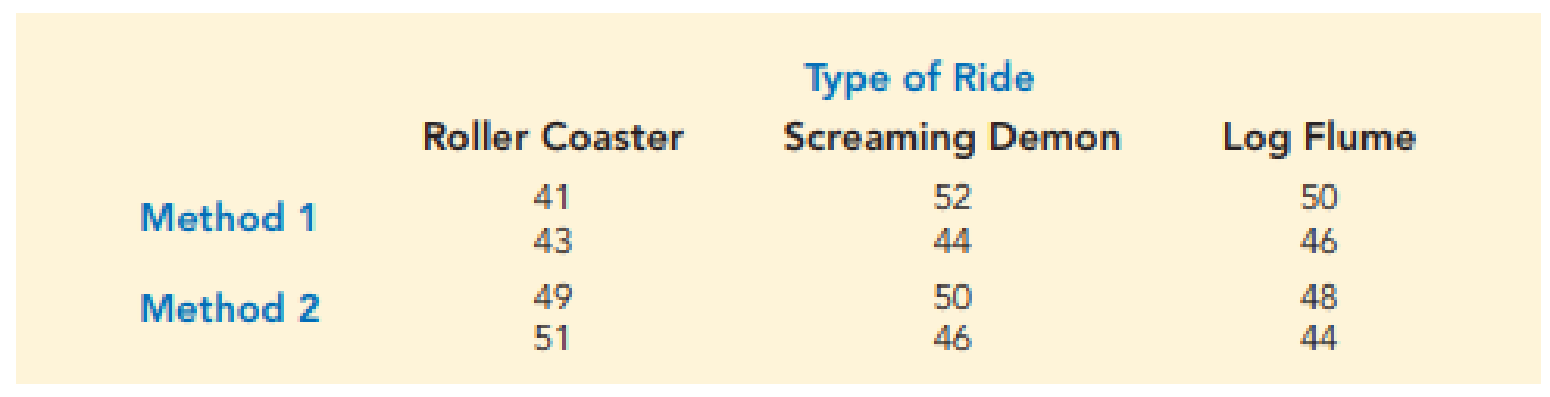
Amusement Park Queues. An amusement park studied methods for decreasing the waiting time (minutes) for rides by loading and unloading riders more efficiently. Two alternative loading/unloading methods have been proposed. To account for potential differences due to the type of ride and the possible interaction between the method of loading and unloading and the type of ride, a factorial experiment was designed. Use the following data to test for any significant effect due to the loading and unloading method, the type of ride, and interaction. Use α = .05.
Expert Solution & Answer
Want to see the full answer?
Check out a sample textbook solution
Students have asked these similar questions
An amusement park studied methods for decreasing the waiting time (minutes) for rides by loading and unloading riders more efficiently. Two alternative loading/unloading methods have been proposed. To account for potential differences due to the type of ride and the possible interaction between the method of loading and unloading and the type of ride, a factorial experiment was designed. Use the following data to test for any significant effect due to the loading and unloading method, the type of ride, and interaction. Use ? = 0.05.
Type of Ride
Roller Coaster
Screaming Demaon
Log Flume
Method 1
41
52
50
43
44
46
Method 2
49
50
48
51
46
44
Find the value of the test statistic for method of loading and unloading.
Test statistic=??
Find the p-value for method of loading and unloading. (Round your answer to three decimal places.)
p-value = ??
State your conclusion about method of loading and unloading.
-Because the p-value ≤ ? = 0.05, method…
A research article on the effect of multitasking on grade performance describes an experiment in which 62 undergraduate business students were randomly assigned to one of two experimental groups. Students in one group were asked to listen to a lecture but were told that they were permitted to use cell phones to send text messages during the lecture. Students in the second group listened to the same lecture but were not permitted to send text messages. Afterwards, students in both groups took a quiz on material covered in the lecture. Data from this experiment are summarized in the accompanying table.
W. Thomas Boyce, a professor and pediatrician at the University of British Columbia, Vancouver, has studied interactions between individual differences in physiology and differences in experience in determining health and well-being. Dr. Boyce found that some children are more sensitive to their environments. They do exceptionally well when the environment is supportive but are much more likely to have mental and physical health problems when the environment has challenges.
You decide to do a similar study, conducting a factorial experiment to test the effectiveness of one environmental factor and one physiological factor on a physical health outcome. As the environmental factor, you choose two levels of stressful life events. As the physiological factor, you choose three levels of immune reactivity. The outcome is number of respiratory illnesses in the previous 12 months, and the research participants are kindergartners.
Chapter 13 Solutions
Modern Business Statistics with Microsoft Excel (MindTap Course List)
Ch. 13.2 - 1. The following data are from a completely...Ch. 13.2 - 2. In a completely randomized design, seven...Ch. 13.2 - 3. Refer to exercise 2.
what hypotheses are...Ch. 13.2 - Prob. 4ECh. 13.2 - 5. In a completely randomized design, 12...Ch. 13.2 - Prob. 6ECh. 13.2 - 7. Three different methods for assembling a...Ch. 13.2 - Prob. 8ECh. 13.2 - 9. To study the effect of temperature on yield in...Ch. 13.2 - Prob. 10E
Ch. 13.2 - Four different paints are advertised as having the...Ch. 13.2 - Restaurant Satisfaction. The Consumer Reports...Ch. 13.3 - The following data are from a completely...Ch. 13.3 - Prob. 14ECh. 13.3 - Testing Chemical Processes. To test whether the...Ch. 13.3 - Prob. 16ECh. 13.3 - Marketing Ethics. In the digital age of marketing,...Ch. 13.3 - Prob. 18ECh. 13.3 - Prob. 19ECh. 13.3 - Minor league Baseball Attendance. The...Ch. 13.4 - Consider the experimental results for the...Ch. 13.4 - Prob. 22ECh. 13.4 - 23. An experiment has been conducted for four...Ch. 13.4 - Prob. 24ECh. 13.4 - The price drivers pay for gasoline often varies a...Ch. 13.4 - SAT Performance. The Scholastic Aptitude Test...Ch. 13.4 - A study reported in the Journal of the American...Ch. 13.5 - A factorial experiment involving two levels of...Ch. 13.5 - Prob. 29ECh. 13.5 - Prob. 30ECh. 13.5 - Amusement Park Queues. An amusement park studied...Ch. 13.5 - Prob. 32ECh. 13.5 - Prob. 33ECh. 13 - Prob. 36SECh. 13 - Prob. 37SECh. 13 - Assembly Methods. Three different assembly methods...Ch. 13 - In a study conducted to investigate browsing...Ch. 13 - Fuel Efficiency of Gasoline Brands. A research...Ch. 13 - Prob. 41SECh. 13 - Prob. 42SECh. 13 - Prob. 43SECh. 13 - Prob. 44SECh. 13 - CASE PROBLEM 1: WENTWORTH MEDICAL CENTER As part...Ch. 13 - CASE PROBLEM 2: COMPENSATION FOR SALES...
Knowledge Booster


Learn more about
Need a deep-dive on the concept behind this application? Look no further. Learn more about this topic, statistics and related others by exploring similar questions and additional content below.Similar questions
- A U.S. study published in The American Journal of Preventive Medicine compared state-level prevalence of firearm ownership in 2002 with state-level rates of firearm assault and firearm robbery in the subsequent year. The investigators found a positive association - meaning that states with higher prevalence of firearm ownership also tended to be the states with higher rates of firearm assault. Which design best describes this study? a)Observational cohort study b)Randomized trial c)Case-control study d)Ecological studyarrow_forwardThe males of stalk-eyed flies (Cyrtodiopsis dalmanni) have long eye stalks. The females sometimes use the length of these eye stalks to choose mates. Is the male’s eye-stalk length affected by the quality of its diet? An experiment was carried out in which two groups of male “stalkies” were reared on different foods (David et al. 2000). One group was fed “corn” (considered a high quality food), while the other was fed “cotton” wool (a food of substantially lower quality). Each male was raised singly and so represents an independent sampling unit. The eye spans (the distance between the eyes) were recorded in millimeters. The raw data, which are plotted as histograms below, are as follows: Corn diet: 2.15, 2.14, 2.13, 2.13, 2.12, 2.11, 2.1, 2.08, 2.08, 2.08, 2.04, 2.05, 2.03, 2.02, 2.01, 2, 1.99, 1.96, 1.95, 1.93, 1.89Cotton diet: 2.12, 2.07, 2.01, 1.93, 1.77, 1.68, 1.64, 1.61, 1.59, 1.58, 1.56, 1.55, 1.54, 1.49, 1.45, 1.43, 1.39, 1.34, 1.33, 1.29, 1.26, 1.24, 1.11, 1.05 a) what is the…arrow_forwardIn the book Business Research Methods (5th ed.), Donald R. Cooper and C. William Emory discuss studying the relationship between on-the-job accidents and smoking. Cooper and Emory describe the study as follows: Suppose a manager implementing a smoke-free workplace policy is interested in whether smoking affects worker accidents. Since the company has complete reports of on-the-job accidents, she draws a sample of names of workers who were involved in accidents during the last year. A similar sample from among workers who had no reported accidents in the last year is drawn. She interviews members of both groups to determine if they are smokers or not. The sample results are given in the following table. On-the-Job Accident Smoker Yes No Row Total Heavy 12 5 17 Moderate 9 10 19 Nonsmoker 13 17 30 Column total 34 32 66 Expected counts are below observed counts Accident No Accident Total Heavy 12 5 17 8.76 8.24…arrow_forward
- An experimenter is interested in the effects of two independent variables onself-esteem. What is better about conducting a factorial experiment thanconducting two separate experiments, one for each independent variable?arrow_forwardA factorial experiment was designed to test for any significant differences in the time needed to perform English to foreign language translations with two computerized language translators. Because the type of language translated was also considered a significant factor, translations were made with both systems for three different languages: Spanish, French, and German. Use the following data for translation time in hours. Language Spanish French German System 1 7 8 15 11 12 19 System 2 6 16 18 10 18 24 Test for any significant differences due to language translator system (Factor A), type of language (Factor B), and interaction. Use = .05. Complete the following ANOVA table (to 2 decimals, if necessary). Round p-value to four decimal places. Source of Variation Sum of Squares Degrees of Freedom Mean Square F p-value Factor A Factor B Interaction Error Total The p-value for Factor A is…arrow_forwardA factorial experiment was designed to test for any significant differences in the time needed to perform English to foreign language translations with two computerized language translators. Because the type of language translated was also considered a significant factor, translations were made with both systems for three different languages: Spanish, French, and German. Use the following data for translation time in hours. Language Spanish French German System 1 7 14 15 11 18 19 System 2 6 15 19 10 17 25 Test for any significant differences due to language translator system (Factor A), type of language (Factor B), and interaction. Use x=.05 Complete the following ANOVA table (to 2 decimals, if necessary). Round your p-value to 4 decimal places. Source of Variation Sum of Squares Degrees of Freedom Mean Square F P-value Factor A Factor B Interaction Error Total The p-value for Factor A is -…arrow_forward
- In the empirical exercises on earning and height in Chapters 4 and 5, you estimated a relatively large and statistically significant effect of a worker’s height on his or her earnings. One explanation for this result is omitted variable bias: Height is correlated with an omitted factor that affects earnings. For example, Case and Paxson (2008) suggest that cognitive ability (or intelligence) is the omitted factor. The mechanism they describe is straightforward: Poor nutrition and other harmful environmental factors in utero and in early childhood have, on average, deleterious effects on both cognitive and physical development. Cognitive ability affects earnings later in life and thus is an omitted variable in the regression. Suppose that the mechanism described above is correct. Explain how this leads to omitted variable bias in the OLS regression of Earnings on Height. Does the bias lead the estimated slope to be too large or too small? [Hint: Review Equation (6.1)]arrow_forwardA factorial experiment was designed to test for any significant differences in the time needed to perform English to foreign language translations with two computerized language translators. Because the type of language translated was also considered a significant factor, translations were made with both systems for three different languages: Spanish, French, and German. Use the following data for translation time in hours. Language Spanish French German System 1 8 14 12 12 18 16 System 2 9 14 17 13 16 23 Test for any significant differences due to language translator system (Factor A), type of language (Factor B), and interaction. Use a=0.05 . Complete the following ANOVA table (to 2 decimals, if necessary). Round your p-value to 4 decimal places. Source of Variation Sum of Squares Degrees of Freedom Mean Square F P-value Factor A Factor B Interaction Error Total The p-value for Factor A is What…arrow_forwardA factorial experiment was designed to test for any significant differences in the time needed to perform English to foreign language translations with two computerized language translators. Because the type of language translated was also considered a significant factor, translations were made with both systems for three different languages: Spanish, French, and German. Use the following data for translation time in hours. Language Spanish French German System 1 7 12 14 11 16 18 System 2 4 12 18 8 14 24 Test for any significant differences due to language translator system (Factor A), type of language (Factor B), and interaction. Use a=.05 . Complete the following ANOVA table (to 2 decimals, if necessary). Round your p-value to 4 decimal places. Source of Variation Sum of Squares Degrees of Freedom Mean Square F P-value Factor A Factor B Interaction Error Totalarrow_forward
- Researchers investigated the possible beneficial effect on heart health of crinking black tea and whether adding mikk to the tea reduces any possible benefit Tiventy-four volunteers Were randomly assigned to one of three groups Every day for month; participants in group drank twvo cups ofhot black tea without mikk; participants in group drank two cups of hot black tea with milk; and participants in group drank twvo cups ofhot water but no tea At the end of the month the fesearchers measured the change in each of the participants heart health. Is it reasonable to zeneralize the study beyond the 24 participants? Explain why or why not.arrow_forwardA factorial experiment was designed to test for any significant differences in the time needed to perform English to foreign language translations with two computerized language translators. Because the type of language translated was also considered a significant factor, translations were made with both systems for three different languages: Spanish, French, and German. Use the following data for translation time in hours. Language Spanish French German System 1 6 13 11 10 17 15 System 2 7 13 14 11 15 20 Test for any significant differences due to language translator system (Factor A), type of language (Factor B), and interaction. Use . Complete the following ANOVA table (to 2 decimals, if necessary). Round your p-value to 4 decimal places. Source of Variation Sum of Squares Degrees of Freedom Mean Square -value Factor A Factor B Interaction Error Totalarrow_forwardA factorial experiment was designed to test for any significant differences in the time needed to perform English to foreign language translations with two computerized language translators. Because the type of language translated was also considered a significant factor, translations were made with both systems for three different languages: Spanish, French, and German. Use the following data for translation time in hours. Language Spanish French German System 1 6 13 11 10 17 15 System 2 7 13 14 11 15 20 Test for any significant differences due to language translator system (Factor A), type of language (Factor B), and interaction. Use . Complete the following ANOVA table (to 2 decimals, if necessary). Round your p-value to 4 decimal places.arrow_forward
arrow_back_ios
arrow_forward_ios
Recommended textbooks for you
 Linear Algebra: A Modern IntroductionAlgebraISBN:9781285463247Author:David PoolePublisher:Cengage Learning
Linear Algebra: A Modern Introduction
Algebra
ISBN:9781285463247
Author:David Poole
Publisher:Cengage Learning
Introduction to experimental design and analysis of variance (ANOVA); Author: Dr. Bharatendra Rai;https://www.youtube.com/watch?v=vSFo1MwLoxU;License: Standard YouTube License, CC-BY