Corporate Finance
3rd Edition
ISBN: 9780132992473
Author: Jonathan Berk, Peter DeMarzo
Publisher: Prentice Hall
expand_more
expand_more
format_list_bulleted
Concept explainers
Videos
Textbook Question
Chapter 13, Problem 2P
Assume that the
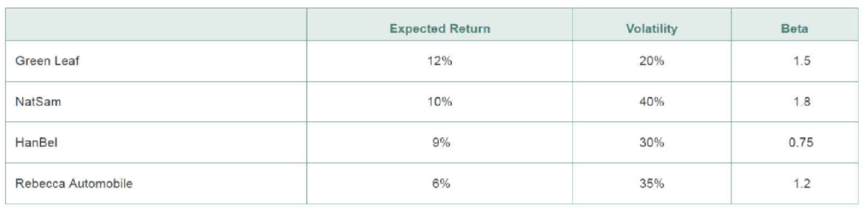
a. At current market prices, which stocks represent buying opportunities?
b. On which stocks should you put a sell order in?
Expert Solution & Answer
Want to see the full answer?
Check out a sample textbook solution
Chapter 13 Solutions
Corporate Finance
Ch. 13.1 - If investors attempt to buy a stock with a...Ch. 13.1 - What is the consequence of investors exploiting...Ch. 13.2 - How can an uninformed or unskilled investor...Ch. 13.2 - Under what conditions will it be possible to earn...Ch. 13.3 - Do investors hold well-diversified portfolios?Ch. 13.3 - Why is the high trading volume observed in markets...Ch. 13.3 - What must be true about the behavior of small,...Ch. 13.4 - What are several systematic behavioral biases that...Ch. 13.4 - Prob. 2CCCh. 13.5 - Prob. 1CC
Ch. 13.5 - Prob. 2CCCh. 13.6 - Prob. 1CCCh. 13.6 - Prob. 2CCCh. 13.7 - Prob. 1CCCh. 13.7 - How can you use the Fama-French-Carhart factor...Ch. 13.8 - Which is the most popular method used by...Ch. 13.8 - Prob. 2CCCh. 13 - Assume that all investors have the same...Ch. 13 - Assume that the CAPM is a good description of...Ch. 13 - Prob. 3PCh. 13 - Prob. 4PCh. 13 - Prob. 5PCh. 13 - Explain what the following sentence means: The...Ch. 13 - You are trading in a market in which you know...Ch. 13 - Prob. 8PCh. 13 - Your brother Joe is a surgeon who suffers badly...Ch. 13 - Prob. 11PCh. 13 - Suppose that all investors have the disposition...Ch. 13 - Prob. 14PCh. 13 - Prob. 15PCh. 13 - Prob. 16PCh. 13 - Prob. 17PCh. 13 - Prob. 18PCh. 13 - Prob. 19PCh. 13 - Prob. 20PCh. 13 - Prob. 21PCh. 13 - Prob. 22PCh. 13 - Prob. 23PCh. 13 - Prob. 24PCh. 13 - Prob. 25PCh. 13 - Prob. 26PCh. 13 - Prob. 27PCh. 13 - Prob. 28P
Knowledge Booster


Learn more about
Need a deep-dive on the concept behind this application? Look no further. Learn more about this topic, finance and related others by exploring similar questions and additional content below.Similar questions
- An analyst has modeled the stock of a company using the Fama-French three-factor model. The market return is 10%, the return on the SMB portfolio (rSMB) is 3.2%, and the return on the HML portfolio (rHML) is 4.8%. If ai = 0, bi = 1.2, ci = 20.4, and di = 1.3, what is the stock’s predicted return?arrow_forwardYou have observed the following returns over time: Assume that the risk-free rate is 6% and the market risk premium is 5%. What are the betas of Stocks X and Y? What are the required rates of return on Stocks X and Y? What is the required rate of return on a portfolio consisting of 80% of Stock X and 20% of Stock Y?arrow_forwardNow assume that the stock is currently selling at $30.29. What is its expected rate of return?arrow_forward
- Market equity beta measures the covariability of a firms returns with all shares traded on the market (in excess of the risk-free interest rate). We refer to the degree of covariability as systematic risk. The market prices securities so that the expected returns should compensate the investor for the systematic risk of a particular stock. Stocks carrying a market equity beta of 1.20 should generate a higher return than stocks carrying a market equity beta of 0.90. Nonsystematic risk is any source of risk that does not affect the covariability of a firms returns with the market. Some writers refer to nonsystematic risk as firm-specific risk. Why is the characterization of nonsystematic risk as firm-specific risk a misnomer?arrow_forwardA stock is trading at $80 per share. The stock is expected to have a yearend dividend of $4 per share (D1 = $4), and it is expected to grow at some constant rate, g, throughout time. The stock’s required rate of return is 14% (assume the market is in equilibrium with the required return equal to the expected return). What is your forecast of gL?arrow_forwardYour client has decided that the risk of the bond portfolio is acceptable and wishes to leave it as it is. Now your client has asked you to use historical returns to estimate the standard deviation of Blandy’s stock returns. (Note: Many analysts use 4 to 5 years of monthly returns to estimate risk, and many use 52 weeks of weekly returns; some even use a year or less of daily returns. For the sake of simplicity, use Blandy’s 10 annual returns.)arrow_forward
arrow_back_ios
arrow_forward_ios
Recommended textbooks for you

 Intermediate Financial Management (MindTap Course...FinanceISBN:9781337395083Author:Eugene F. Brigham, Phillip R. DavesPublisher:Cengage Learning
 EBK CONTEMPORARY FINANCIAL MANAGEMENTFinanceISBN:9781337514835Author:MOYERPublisher:CENGAGE LEARNING - CONSIGNMENT
 Financial Reporting, Financial Statement Analysis...FinanceISBN:9781285190907Author:James M. Wahlen, Stephen P. Baginski, Mark BradshawPublisher:Cengage Learning
Intermediate Financial Management (MindTap Course...
Finance
ISBN:9781337395083
Author:Eugene F. Brigham, Phillip R. Daves
Publisher:Cengage Learning
EBK CONTEMPORARY FINANCIAL MANAGEMENT
Finance
ISBN:9781337514835
Author:MOYER
Publisher:CENGAGE LEARNING - CONSIGNMENT
Financial Reporting, Financial Statement Analysis...
Finance
ISBN:9781285190907
Author:James M. Wahlen, Stephen P. Baginski, Mark Bradshaw
Publisher:Cengage Learning
Portfolio return, variance, standard deviation; Author: MyFinanceTeacher;https://www.youtube.com/watch?v=RWT0kx36vZE;License: Standard YouTube License, CC-BY