Concept explainers
Videos
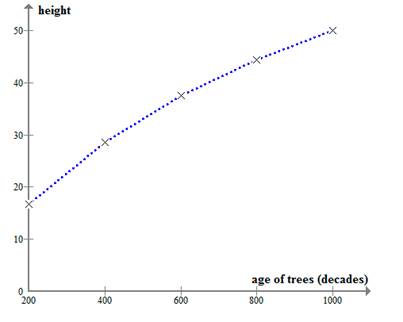
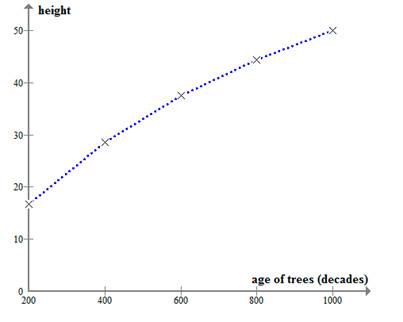
To sketch: The graph of the function by plotting the height h on the vertical axis and the age in decades on the horizontal axis.
Answer to Problem 38E
The graph of the function by plotting the height h on the vertical axis and the age in decades on the horizontal axis as given below,
Explanation of Solution
Given information:
The height of the tree
Calculation:
The height of the tree
Where a represents age of the tree in years for
Now, for
For
For
For
For
For
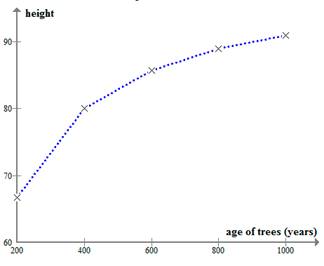
We can draw the graph of the function
Let
Then we have
Hence, height of the tree
For
For
For
For
For
The graph of the function by plotting the height h on the vertical axis and the age in decades on the horizontal axis as given below,
Want to see more full solutions like this?
Chapter 1 Solutions
Modeling the Dynamics of Life: Calculus and Probability for Life Scientists


 Big Ideas Math A Bridge To Success Algebra 1: Stu...AlgebraISBN:9781680331141Author:HOUGHTON MIFFLIN HARCOURTPublisher:Houghton Mifflin Harcourt
 Glencoe Algebra 1, Student Edition, 9780079039897...AlgebraISBN:9780079039897Author:CarterPublisher:McGraw Hill
 Functions and Change: A Modeling Approach to Coll...AlgebraISBN:9781337111348Author:Bruce Crauder, Benny Evans, Alan NoellPublisher:Cengage Learning
 College Algebra (MindTap Course List)AlgebraISBN:9781305652231Author:R. David Gustafson, Jeff HughesPublisher:Cengage Learning
 Algebra & Trigonometry with Analytic GeometryAlgebraISBN:9781133382119Author:SwokowskiPublisher:Cengage