
Concept explainers
Videos
a.
Find the regression equation.
a.
Answer to Problem 53CE
The regression equation is
Explanation of Solution
Calculation:
The values of x and y are given.
Regression equation:
Software procedure:
Step-by-step procedure to obtain the ‘Regression equation’ using the MegaStat software:
- In an EXCEL sheet enter the data values of x and y.
- Go to Add-Ins > MegaStat >
Correlation /Regression >Regression Analysis . - Select input
range as ‘Sheet1!$B$2:$B$16’ under Y/Dependent variable. - Select input range ‘Sheet1!$A$2:$A$16’ under X/Independent variables.
- Click on OK.
Output obtained using the MegaStat software is as given below:
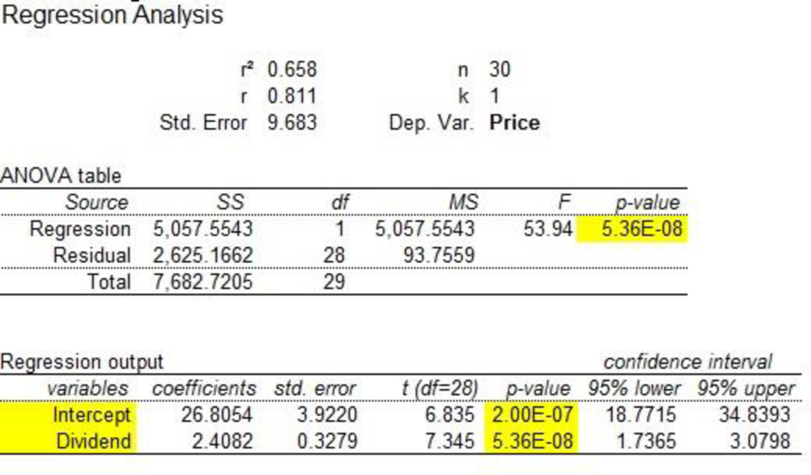
From the output, the regression equation is
Where, y is the price per share and x is the dividend.
b.
Test whether the slope is significant or not.
b.
Answer to Problem 53CE
There is sufficient evidence to conclude that the slope of the regression line is different from zero.
Explanation of Solution
It is given that the regression equation is
The sample size is 30 and the standard error of the slope is 0.3279.
From the regression equation, the estimated slope of the regression line is
Let
The given test hypotheses are as follows:
Null hypothesis:
That is, the slope of the regression line is equal to zero.
Alternate hypothesis:
That is, the slope of the regression line is not equal to zero.
Assume that the level of significance is 0.05.
Test statistic:
The t-test statistic is as follows:
Where,
Thus, the following is obtained:
Here, the sample size is
Critical value:
Software procedure:
Step-by-step software procedure to obtain the critical value
- Open an EXCEL file.
- In cell A1, enter the formula “=T.INV(0.025,28)”.
Output obtained using the EXCEL is given as follows:
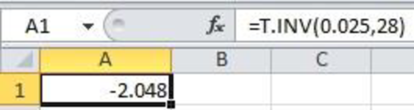
From the EXCEL output, the critical value is –2.048 (
Decision based on the critical value:
Reject the null hypothesis, if
Conclusion:
The t-calculated value is –7.34 and the critical value is –2.048.
That is,
Thus, the null hypothesis is rejected.
Hence, there is sufficient evidence to conclude that the slope of the regression line is different from zero.
c.
Find and interpret the value of coefficient of determination.
c.
Answer to Problem 53CE
The coefficient of determination is 0.658.
Explanation of Solution
From Part (a), the value of coefficient of determination is 0.658.
Therefore, 65.8% of variation in the ‘selling price’ is explained by ‘the annual dividend’.
d.
Find the value of
Test whether the correlation in the population is greater than zero or not.
d.
Answer to Problem 53CE
The correlation coefficient is 0.811.
There is enough evidence to infer that the correlation in the population is greater than zero.
Explanation of Solution
Calculation:
The correlation coefficient is as follows:
The given sample size is 30 and correlation is 0.811.
Denote the population correlation as
The hypotheses are given below:
Null hypothesis:
That is, the correlation in the population is less than or equal to zero.
Alternative hypothesis:
That is, the correlation in the population is greater than zero.
Test statistic:
The test statistic is as follows:
Here, the sample size is 30 and the correlation coefficient is 0.811.
The test statistic is as follows:
Degrees of freedom:
The level of significance is 0.05. Therefore,
Critical value:
Software procedure:
Step-by-step software procedure to obtain the critical value using the EXCEL software:
- Open an EXCEL file.
- In cell A1, enter the formula “=T.INV (0.95, 28)”.
Output obtained using the EXCEL is given as follows:
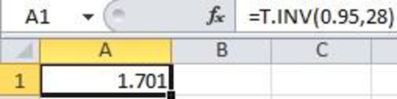
From the EXCEL output, the critical value is 1.701.
Conclusion:
The value of test statistic is 7.34 and the critical value is 1.701.
Here,
By the rejection rule, reject the null hypothesis.
Thus, there is enough evidence to infer that the correlation in the population is greater than zero.
Want to see more full solutions like this?
Chapter 13 Solutions
Statistical Techniques in Business and Economics, 16th Edition


- Find the equation of the regression line for the following data set. x 1 2 3 y 0 3 4arrow_forwardFor the following exercises, use Table 4 which shows the percent of unemployed persons 25 years or older who are college graduates in a particular city, by year. Based on the set of data given in Table 5, calculate the regression line using a calculator or other technology tool, and determine the correlation coefficient. Round to three decimal places of accuracyarrow_forward

 Glencoe Algebra 1, Student Edition, 9780079039897...AlgebraISBN:9780079039897Author:CarterPublisher:McGraw Hill
 Functions and Change: A Modeling Approach to Coll...AlgebraISBN:9781337111348Author:Bruce Crauder, Benny Evans, Alan NoellPublisher:Cengage Learning
 Big Ideas Math A Bridge To Success Algebra 1: Stu...AlgebraISBN:9781680331141Author:HOUGHTON MIFFLIN HARCOURTPublisher:Houghton Mifflin Harcourt