
Concept explainers
Videos
a.
Identify the dependent variable and independent variable.
a.
Answer to Problem 1SR
The dependent variable is the ‘sales revenue’ and the independent variable is the ‘advertising expense’.
Explanation of Solution
Data on the number of times the advertisement was aired and digital camera sales are given.
Independent variable:
The variable that can be used to predict the values of other variable is called an independent variable.
Dependent variable:
The variable that can be predicted by other variables is called a response variable or a dependent variable.
Here, the variable ‘sales revenue’ can be predicted using the variable ‘advertising expense’. Therefore, the dependent variable is the ‘sales revenue’ and the independent variable is the ‘advertising expense’.
b.
Construct a
b.
Answer to Problem 1SR
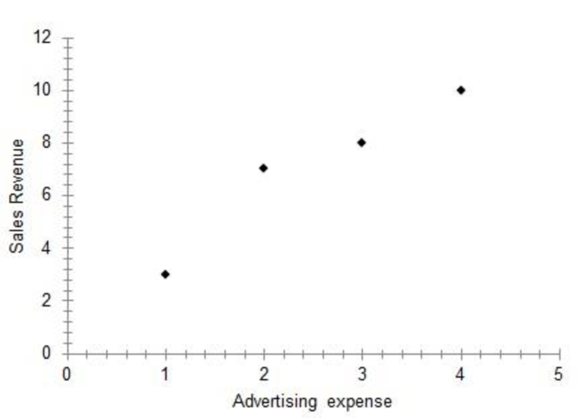
The scatter diagram of the data is represented below:
Explanation of Solution
Calculation:
The scatterplot of the data is as follows:
Software Procedure:
Step-by-step procedure to obtain the scatterplot using Mega Stat software:
- In an EXCEL sheet enter the data values of x and y.
- Go to Add-Ins > Mega Stat >
Correlation/Regression > Scatterplot. - Enter horizontal axis as $A$1:$A$5 and vertical axis as $B$1:$B$5.
- Click on OK.
The scatterplot of the data shows an increasing trend.
c.
Find the
c.
Answer to Problem 1SR
Thus, the
Explanation of Solution
Calculation:
Software procedure:
Step-by-step procedure to obtain the correlation matrix using Mega Stat software:
- In an EXCEL sheet enter the data values of x and y.
- Go to Add-Ins > Mega Stat > Correlation/Regression > Correlation matrix.
- Enter Input
Range as $A$1:$b$5. - Click on OK.
Output obtained using Mega Stat is given as follows:
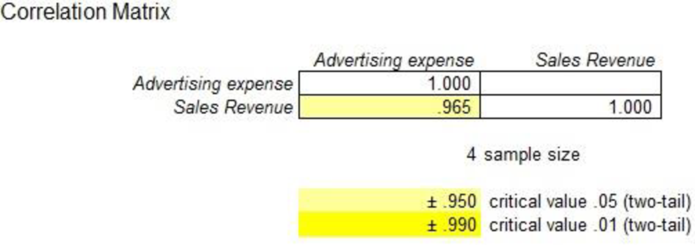
Thus, the correlation coefficient is 0.965.
d.
Interpret the strength of the correlation coefficient.
d.
Explanation of Solution
From Part (c), the correlation coefficient is 0.965. Since the correlation coefficient is positive and close to 1, there is a strong
Want to see more full solutions like this?
Chapter 13 Solutions
Statistical Techniques in Business and Economics, 16th Edition


- The business problem facing the director of broadcasting operations for a television station was the issue of standby hours and what factors were related to standby hours. The study included the following variables:Standby hours (Y) –Total number of standby hours in a week weekly staff count (X1) –Weekly total of people-days. Remote engineering hours (X2) –Total number of engineering hours worked by employees at locations away from the central plant data were collected for 26 weeks. These data are organized and stored in. A)Interpret the meaning of the coefficients b1and b2 in this problem B)What is the significance of b0? C)Predict the mean standby hours for a week in which the weekly staff count was 310 people-days and the remote-engineering hours total was 400 Standby_hours_(Y) Total_Staff_Present(X1) Remote_Hours_(X2) 247 338 414 177 333 600 269 358 656 211 372 631 196 337 528 135 289 419 195 334 382 118 293 399 116 325 343 147 311 338 154 304 353 146 312…arrow_forwardGoogle has changed its strategy with regard to how much and over which media it invests in advertising. The following table shows Google's marketing budget in millions of dollars for 2008 and 2011 (The Wall Street Journal, March 27, 2012). 2008 2011 Internet $26.0 $123.3 Newspaper, etc. $4.0 $20.7 Television $0.0 $69.3 a. Select a side-by-side bar chart with year as the variable on the horizontal axis.arrow_forwardIn general, ___________% of the values in a data set lie at or below the 28 th percentile. _______________ % of the values in a data set lie at or above the 90 th percentile.. If a sample consists of 700 test scores, _________of them would be at or below the 52 th percentile. If a sample consists of 700 test scores, ________ of them would be at or above the 64 th percentile.arrow_forward
- If we were conducting a hypothesis test to determine if there was a linear relationship between reading ability and IQ score then the research hypothesis would be? Group of answer choices: H0:ρ≠0 H1:ρ≠0 H1:r≠0 H0:r≠0arrow_forwardLieutenant Dan, a personal trainer, was interested in whether or not there was a linear relationship between the number of visits his soldiers made to the gym each week and the average amount of time they exercised per visit. He took the following data. Soldier 1 2 3 4 5 6 Number of visits per week 1 3 4 2 3 5 Average time spent exercising per visit (hours) 2 1.5 1 2 2 0.30 Using the best fit line, estimate the average time spent exercising per visit for 4 visits per week. Please explain how you derived the answerarrow_forwardAn economist at Nedbank ran a study of the relationship between FTSE/JSE All Shares index return (JALSH) and consumer price index (CPI) from 2006 to 2017, the data collected is shown in the Table 1 below. FTSE/JSE All Shares index return (JALSH) and consumer price index (CPI) from 2006 to 2017. Year JALSH (Y) CPI (X) 2006 0.41 4.7 2007 0.19 7.1 2008 -0.23 11.5 2009 0.32 7.1 2010 0.19 4.3 2011 0.03 5.0 2012 0.27 5.6 2013 0.21 5.7 2014 0.11 6.1 2015 0.05 4.6 2016 0.00 6.4 2017 0.21 5.3 The estimated regression…arrow_forward
- The following data relate the sales figures of the bar in Mark kaltenbach's small bed-and-breakfast inn in Portland, to the number of guests registered that week: Week Guest Bar sales 1 16 $330 2 12 $270 3 18 $380 4 14 $315 a) The simple linear regression equation that relates bar sales to number of guests (not to time) is ( round your response to one decimal place) Bar sales= ___+___Xguestsarrow_forwardWhich of the following refers to the scenario in which the relationship between the dependent variable and one independent variable is different at different values of a second independent variable?arrow_forwardDixie Showtime table shows how weekly gross revenue is dependent on two variables the television and newspaper advertising expenses, is that correct? Discuss by givingthree new examples.arrow_forward
 MATLAB: An Introduction with ApplicationsStatisticsISBN:9781119256830Author:Amos GilatPublisher:John Wiley & Sons Inc
 Probability and Statistics for Engineering and th...StatisticsISBN:9781305251809Author:Jay L. DevorePublisher:Cengage Learning
 Statistics for The Behavioral Sciences (MindTap C...StatisticsISBN:9781305504912Author:Frederick J Gravetter, Larry B. WallnauPublisher:Cengage Learning
 Elementary Statistics: Picturing the World (7th E...StatisticsISBN:9780134683416Author:Ron Larson, Betsy FarberPublisher:PEARSON
 The Basic Practice of StatisticsStatisticsISBN:9781319042578Author:David S. Moore, William I. Notz, Michael A. FlignerPublisher:W. H. Freeman
 Introduction to the Practice of StatisticsStatisticsISBN:9781319013387Author:David S. Moore, George P. McCabe, Bruce A. CraigPublisher:W. H. Freeman