Despite booming new car sales with their cha-ching sounds, the average age of vehicles on U.S. roads is not going down. The bar graph shows the average price of new cars in the United States and average age of cars on U.S. mads for two selected years. Exercises 5-6 are based on the information displayed by the graph. In 2014, the average age of cars on U.S. roads was 11.3 years. For the period shown, this average age increased by approximately 0.2 year per year. If this trend continues, how many years after 2014 will the average age of vehicles on U.S. roads be 12.3 years? In which year will this occur?
Despite booming new car sales with their cha-ching sounds, the average age of vehicles on U.S. roads is not going down. The bar graph shows the average price of new cars in the United States and average age of cars on U.S. mads for two selected years. Exercises 5-6 are based on the information displayed by the graph. In 2014, the average age of cars on U.S. roads was 11.3 years. For the period shown, this average age increased by approximately 0.2 year per year. If this trend continues, how many years after 2014 will the average age of vehicles on U.S. roads be 12.3 years? In which year will this occur?
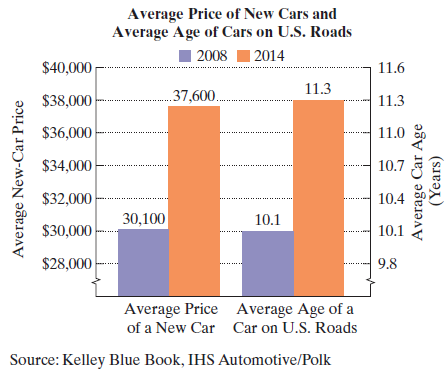
Despite booming new car sales with their cha-ching sounds, the average age of vehicles on U.S. roads is not going down. The bar graph shows the average price of new cars in the United States and average age of cars on U.S. mads for two selected years. Exercises 5-6 are based on the information displayed by the graph.
In 2014, the average age of cars on U.S. roads was 11.3 years. For the period shown, this average age increased by approximately 0.2 year per year. If this trend continues, how many years after 2014 will the average age of vehicles on U.S. roads be 12.3 years? In which year will this occur?
On average, every minute of every day, 137 babies are born. The bar graph represents the results of a single day of births, deaths,and population increase worldwide.
Each day, the number of births in the world is 141 thousand less than three times the number of deaths.
a. If the population increase in a single day is 197 thousand, determine the number of births and deaths per day.
There are 366 thousand births per day.
There are 169 thousand deaths per day.
B. If the population increase in a single day is 197 thousand, by how many millions of people does the worldwide population increase each year?
If there was a baby boom of Oompa Loompas ready to work for free, what will happen to the Willy Wonka chocolate market? A few things to think about:
Has this affected supply or demand of Willy Wonka Chocolate?
What has happened to the price of Willy Wonka chocolate?
Please justify your answer by graphing the change in either supply or demand, as well as the change in price.
(Looking at the graph, we can see that the blue line, representing the population proportion in the USA, is consistently increasing over time and eventually reaches a value of around 0.33 (33%) after 100 years. In contrast, the green line, representing the population proportion in China, is decreasing over time and eventually reaches a value of around 0.67 (67%) after 100 years. The red line, representing the population proportion in Canada, remains relatively constant over time and has the lowest value among the three countries)
By year 100, the USA has the highest proportion of the population, followed by China and Canada.
Does my analysis correct ?
Chapter 1 Solutions
Algebra And Trigonometry With Integrated Review, Books A La Carte Edition, Plus Mylab Math With Pearson Etext -- Title-specific Access Card Package (6th Edition)
Need a deep-dive on the concept behind this application? Look no further. Learn more about this topic, algebra and related others by exploring similar questions and additional content below.
Compound Interest Formula Explained, Investment, Monthly & Continuously, Word Problems, Algebra; Author: The Organic Chemistry Tutor;https://www.youtube.com/watch?v=P182Abv3fOk;License: Standard YouTube License, CC-BY
Applications of Algebra (Digit, Age, Work, Clock, Mixture and Rate Problems); Author: EngineerProf PH;https://www.youtube.com/watch?v=Y8aJ_wYCS2g;License: Standard YouTube License, CC-BY


 Glencoe Algebra 1, Student Edition, 9780079039897...AlgebraISBN:9780079039897Author:CarterPublisher:McGraw Hill
 Algebra: Structure And Method, Book 1AlgebraISBN:9780395977224Author:Richard G. Brown, Mary P. Dolciani, Robert H. Sorgenfrey, William L. ColePublisher:McDougal Littell
 Holt Mcdougal Larson Pre-algebra: Student Edition...AlgebraISBN:9780547587776Author:HOLT MCDOUGALPublisher:HOLT MCDOUGAL
 Big Ideas Math A Bridge To Success Algebra 1: Stu...AlgebraISBN:9781680331141Author:HOUGHTON MIFFLIN HARCOURTPublisher:Houghton Mifflin Harcourt