
Concept explainers
Videos
The authors of the paper “Decreased Brain Volume in Adults with Childhood Lead Exposure” (Public Library of Science Medicine [May 27, 2008]: e112) studied the relationship between childhood environmental lead exposure and a measure of brain volume change in a particular region of the brain. Data were given for x = Mean childhood blood lead level (μg/dL) and y = Brain volume change (BVC, in percent). A subset of data read from a graph that appeared in the paper was used to produce the accompanying Minitab output.
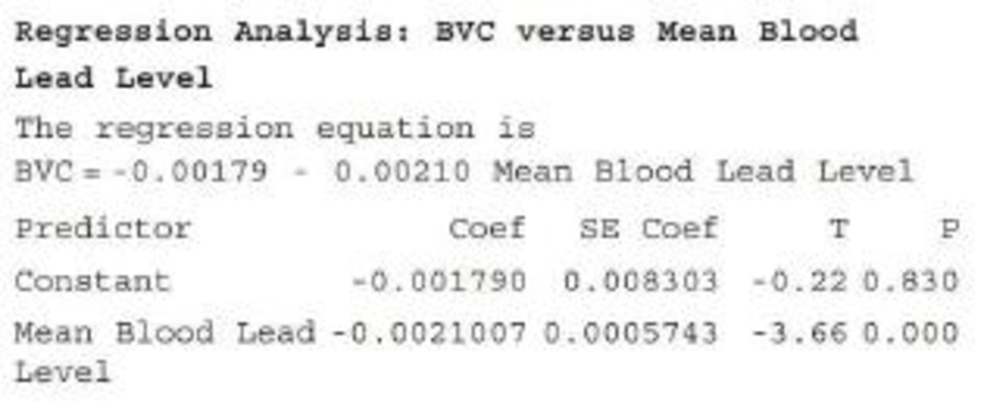
Carry out a hypothesis test to decide if there is convincing evidence of a useful linear relationship between x and y. Assume that the basic assumptions of the simple linear regression model are reasonably met.
Want to see the full answer?
Check out a sample textbook solution
Chapter 13 Solutions
Introduction to Statistics and Data Analysis


- What does the y -intercept on the graph of a logistic equation correspond to for a population modeled by that equation?arrow_forwardRetinitis pigmentosa (RP) is a hereditary ocular diseasein which patches of pigment appear on the retina, potentially resulting in substantial vision loss and in somecases complete blindness. An important issue is how fastthe subjects decline. Visual field is an important measureof area of vision, which is measured in degree2. A visualfield area for a normal person is around 11,000 degree2.The longitudinal data in Table 11.29 were provided by anindividual patient.Table 11.29 Longitudinal visual field data forone RP patientTime Visual field area lnVisit (yr) (degree2) (visual field area)1 0 3059 8.032 1 3053 8.023 2 1418 7.264 3 1692 7.435 4 1978 7.596 5 1567 7.367 6 1919 7.568 7 1998 7.609 11 1648 7.4110 13 1721 7.4511 15 1264 7.14mean 6.09 1938 7.532sd 4.97 597 0.280Suppose the rate of change of ln (visual field) is a linearfunction of follow-up time.11.103 Write down a linear regression model that summarizes this relationship.arrow_forwardRetinitis pigmentosa (RP) is a hereditary ocular diseasein which patches of pigment appear on the retina, potentially resulting in substantial vision loss and in somecases complete blindness. An important issue is how fastthe subjects decline. Visual field is an important measureof area of vision, which is measured in degree2. A visualfield area for a normal person is around 11,000 degree2.The longitudinal data in Table 11.29 were provided by anindividual patient.Table 11.29 Longitudinal visual field data forone RP patientTime Visual field area lnVisit (yr) (degree2) (visual field area)1 0 3059 8.032 1 3053 8.023 2 1418 7.264 3 1692 7.435 4 1978 7.596 5 1567 7.367 6 1919 7.568 7 1998 7.609 11 1648 7.4110 13 1721 7.4511 15 1264 7.14mean 6.09 1938 7.532sd 4.97 597 0.280Suppose the rate of change of ln (visual field) is a linearfunction of follow-up time.11.103 Write down a linear regression model that summarizes this relationship.11.104 Fit the regression line using the method of…arrow_forward
- Forest bathing, also called Shinrin-yoke, is the practice of taking short, leisurely walks in a forest to enhance positive health. To test if forest bathing and mood are related, a clinical psychologist records the time spent forest bathing in minutes (X) and the corresponding change I mood using a standard self report affect grid (Y) among 8 patients with a history of depression. The data are given in the following table. times spent forest bathing (in minutes) change in mood X Y 32 +24 24 +20 28 +25 17 +22 12 +16 Compute the method of least squares to find the equation of the regression line. Use the regression equation computed in part (a) to determine the predicted change in mood of a person who spends 20 minutes forest bathing.arrow_forwardReduced heart rate variability (HRV) is known to be a predictor of mortality after a heart attack. One measure of HRV is the average normal-to-normal beat interval (in milliseconds) for a 24-hr time period. Twenty-two heart attack patients who were dog owners and 80 heart attack patients who did not own a dog participated in a study of the effect of pet ownership on HRV, resulting in the summary statistics shown in the accompanying table.arrow_forward
 Glencoe Algebra 1, Student Edition, 9780079039897...AlgebraISBN:9780079039897Author:CarterPublisher:McGraw Hill
 Big Ideas Math A Bridge To Success Algebra 1: Stu...AlgebraISBN:9781680331141Author:HOUGHTON MIFFLIN HARCOURTPublisher:Houghton Mifflin Harcourt
 Holt Mcdougal Larson Pre-algebra: Student Edition...AlgebraISBN:9780547587776Author:HOLT MCDOUGALPublisher:HOLT MCDOUGAL