
Concept explainers
Videos
The shelf life of packaged food depends on many factors. Dry cereal is considered to be a moisture-sensitive product (no one likes soggy cereal!) with the shelf life determined primarily by moisture content. In a study of the shelf life of one particular brand of cereal, x = Time on shelf (days stored at 73°F and 50% relative humidity) and y = Moisture content (%) were recorded. The resulting data are from “Computer Simulation Speeds Shelf Life Assessments” (Package Engineering [1983]: 72–73).
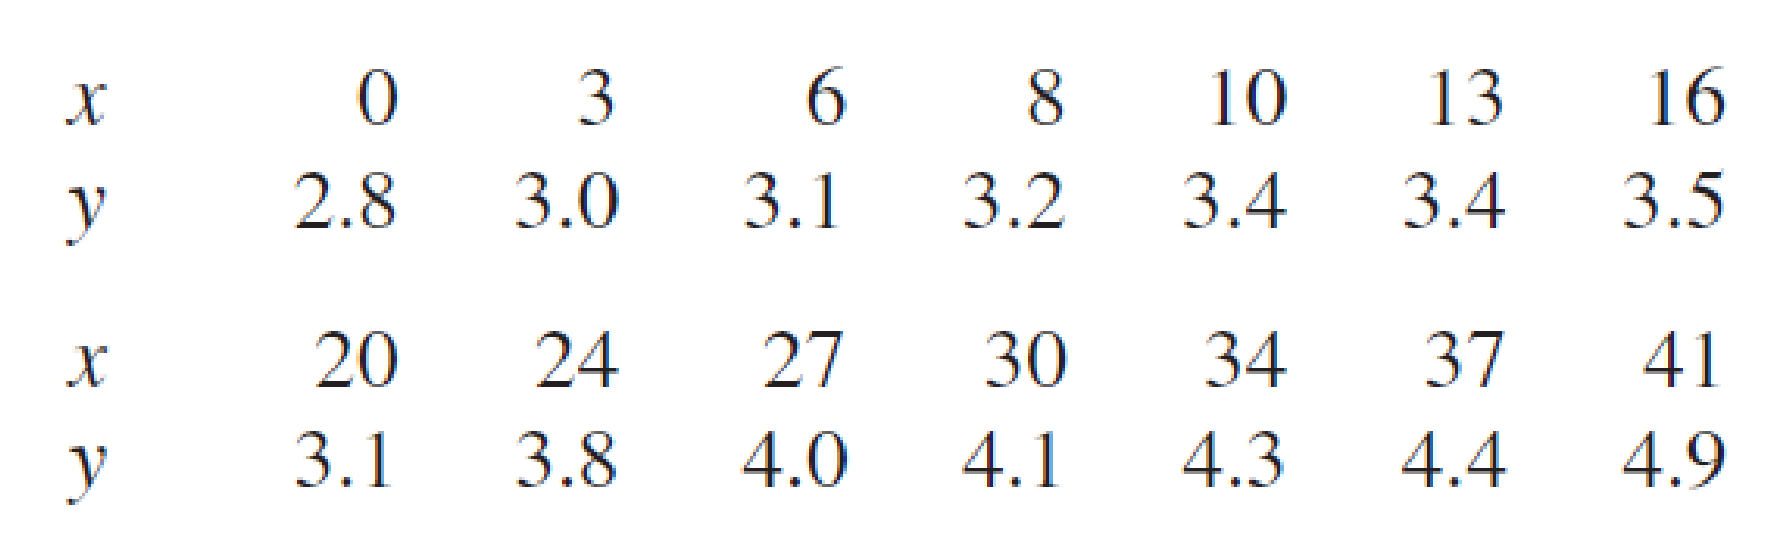
- a. Summary quantities are
Find the equation of the estimated regression line for predicting moisture content from time on the shelf.
- b. Does the simple linear regression model provide useful information for predicting moisture content from knowledge of shelf time?
- c. Find a 95% interval for the moisture content of an individual box of cereal that has been on the shelf 30 days.
- d. According to the article, taste tests indicate that this brand of cereal is unacceptably soggy when the moisture content exceeds 4.1. Based on your interval in Part (c), do you think that a box of cereal that has been on the shelf 30 days will be acceptable? Explain.

Trending nowThis is a popular solution!

Chapter 13 Solutions
Introduction to Statistics and Data Analysis


- What does the y -intercept on the graph of a logistic equation correspond to for a population modeled by that equation?arrow_forwardFind the equation of the regression line for the following data set. x 1 2 3 y 0 3 4arrow_forwardan attempt to develop a model of wine quality as judged by wine experts, data on alcohol content and wine quality was collected from variants of a particular wine. From a sample of 12wines, a model was created using the percentages of alcohol to predict wine quality. For those data, SR=18,671 and SST=27,382.Use this information to complete parts (a) through (c) below. Please complete part 3(B) ONLY. Question content area bottom Part 1 a. Determine the coefficient of determination, r2, and interpret its meaning. r2=0.682 (Round to three decimal places as needed.) Part 2 Interpret the meaning of r2. It means that 68.2 of the variation in wine quality can be explained by the variation in alcohol content. (Round to one decimal place as needed.) Part 3 b. Determine the standard error of the estimate. SYX= (Round to four decimal places as needed.)arrow_forward
- The glycemic index (GI) is a rating system for foods containing carbohydrates. It shows how quickly each food affects your blood sugar (glucose) level when that food is eaten on its own. A random sample of 33 children were provided with a breakfast of low GI foods on one day and high GI foods on another. The two breakfasts contained the same quantities of carbohydrate, fat and protein. On each day a buffet lunch was provided, and the number of calories eaten at lunchtime were recorded. On the first day the children ate a low GI breakfast and on the second day a high GI breakfast. Let be the true mean of the differences in calorie intake for a high GI and a low GI breakfast, respectively. The researcher wants to conduct inference on to determine whether the kind of breakfast eaten has an effect on mean calorie intake. The differences are calculated as calorie intake after high-GI breakfast minus calorie intake after low-GI breakfast. The sample mean of the differences of 63.543…arrow_forwardThe glycemic index (GI) is a rating system for foods containing carbohydrates. It shows how quickly each food affects your blood sugar (glucose) level when that food is eaten on its own. A random sample of 33 children were provided with a breakfast of low GI foods on one day and high GI foods on another. The two breakfasts contained the same quantities of carbohydrate, fat and protein. On each day a buffet lunch was provided, and the number of calories eaten at lunchtime were recorded. On the first day the children ate a low GI breakfast and on the second day a high GI breakfast. Let be the true mean of the differences in calorie intake for a high GI and a low GI breakfast, respectively. The researcher wants to conduct inference on to determine whether the kind of breakfast eaten has an effect on mean calorie intake. The differences are calculated as calorie intake after high-GI breakfast minus calorie intake after low-GI breakfast. The sample mean of the differences of 63.543…arrow_forwardHoaglin, Mosteller, and Tukey (1983) presented data on blood levels of beta-endorphin as a function of stress. They took beta-endorphin levels for 19 patients 12 hours before surgery and again 10 minutes before surgery. The data are presented below, in fmol/ml Based on these date, what effect does icreased stressed have on endorphin levels. Solve by hand or SPSS. Participant 12 hours before 10 minutes before 1 10 6.5 2 6.5 14.0 3 8.0 13.5 4 12 18 5 5.0 14.5 6 11.5 9.0 7 5.0 18.0 8 3.5…arrow_forward
- A study is conducted to determine the relationship between study hours and exam scores, what is the dependent variable in this scenario?arrow_forwardOcean currents are important in studies of climate change, as well as ecology studies of dispersal of plankton. Drift bottles are used to study ocean currents in the Pacific near Hawaii, the Solomon Islands, New Guinea, and other islands. Let x represent the number of days to recovery of a drift bottle after release and y represent the distance from point of release to point of recovery in km/100. The following data are representative of one study using drift bottles to study ocean currents. 203 x days y km/100 72 76 32 14.7 94 11.7 19.5 5.3 35.6 (a) Verify that Ex = 477, Ey = 86.8, Ex? = 62,029, Ey2 = 2028.68, Exy = 11036.6, and r= 0.93853. Ex Ey Ex? Ey2| Exy (b) Use a 1% level of significance to test the claim p> 0. (Use 2 decimal places.) critical t Conclusion Reject the null hypothesis, there is sufficient evidence that p > 0. Reject the null hypothesis, there is insufficient evidence that p > 0. O Fail to reject the null hypothesis, there is insufficient evidence that p > 0. O…arrow_forwardWould someone familiar with SPSS be able to help with sub-question d please?arrow_forward
- The November 24, 2001, issue of The Economist published economic data for 15 industrialized nations. Included were the percent changes in gross domestic product (GDP), industrial production (IP), consumer prices (CP), and producer prices (PP) from Fall 2000 to Fall 2001, and the unemployment rate in Fall 2001 (UNEMP). An economist wants to construct a model to predict GDP from the other variables. A fit of the model GDP = , + P,IP + 0,UNEMP + f,CP + P,PP + € yields the following output: The regression equation is GDP = 1.19 + 0.17 IP + 0.18 UNEMP + 0.18 CP – 0.18 PP Predictor Coef SE Coef тР Constant 1.18957 0.42180 2.82 0.018 IP 0.17326 0.041962 4.13 0.002 UNEMP 0.17918 0.045895 3.90 0.003 CP 0.17591 0.11365 1.55 0.153 PP -0.18393 0.068808 -2.67 0.023 Predict the percent change in GDP for a country with IP = 0.5, UNEMP = 5.7, CP = 3.0, and PP = 4.1. a. b. If two countries differ in unemployment rate by 1%, by how much would you predict their percent changes in GDP to differ, other…arrow_forwardA study was undertaken to see how accurate food labeling for calories on food that is considered reduced calorie. The group measured the amount of calories for each item of food and then found the percent difference between measured and labeled food, . The group also looked at food that was nationally advertised, regionally distributed, or locally prepared. The data is in table #11.3.5 ("Calories datafile," 2013). Do the data indicate that at least two of the mean percent differences between the three groups are different? Test at the 10% level. Table #11.3.5: Percent Differences Between Measured and Labeled Food National Advertised Regionally Distributed Locally Prepared 2 41 15 -28 46 60 -6 2 250 8 25 145 6 39 6 -1 16.5 80 10 17 95 13 28 3 15 -3 -4 14 -4 34 -18 42 10 5 3 -7 3 -0.5 -10…arrow_forwardTwo of the hottest smartphones on the market are the newly released iPhone6 and the Samsung Galaxy S6. CNet.com offers online reviews of all major cell phones, including battery life tests. In a review of the iPhone6, the talk-time battery life of 35 iPhones was measured. Similarly, the talk-time battery life of 30 Galaxy S6s was measured. Two outputs are given below. Which is appropriate for analyzing the data collected? Output 1 Output 2 Using the StatCrunch output chosen above, determine if there is a difference in the mean battery life for the two phones. Use a significance level of 0.01 when conducting the test. Select the appropriate hypotheses. Make sure the notation used in the hypotheses agrees with the type of samples selected in the output. Ho:μd=0Ho:μd=0Ha:μd<0Ha:μd<0 Ho:μd=0Ho:μd=0Ha:μd≠0Ha:μd≠0 Ho:μd=0Ho:μd=0Ha:μd>0Ha:μd>0 Ho:μ1=μ2Ho:μ1=μ2Ha:μ1>μ2Ha:μ1>μ2 Ho:μ1=μ2Ho:μ1=μ2Ha:μ1≠μ2Ha:μ1≠μ2 Ho:μ1=μ2Ho:μ1=μ2Ha:μ1<μ2Ha:μ1<μ2 αα =…arrow_forward
 Linear Algebra: A Modern IntroductionAlgebraISBN:9781285463247Author:David PoolePublisher:Cengage Learning
 Algebra & Trigonometry with Analytic GeometryAlgebraISBN:9781133382119Author:SwokowskiPublisher:Cengage
 Glencoe Algebra 1, Student Edition, 9780079039897...AlgebraISBN:9780079039897Author:CarterPublisher:McGraw Hill
 Big Ideas Math A Bridge To Success Algebra 1: Stu...AlgebraISBN:9781680331141Author:HOUGHTON MIFFLIN HARCOURTPublisher:Houghton Mifflin Harcourt
 Functions and Change: A Modeling Approach to Coll...AlgebraISBN:9781337111348Author:Bruce Crauder, Benny Evans, Alan NoellPublisher:Cengage Learning