
Elementary Statistics ( 3rd International Edition ) Isbn:9781260092561
3rd Edition
ISBN: 9781259969454
Author: William Navidi Prof.; Barry Monk Professor
Publisher: McGraw-Hill Education
expand_more
expand_more
format_list_bulleted
Concept explainers
Videos
Textbook Question
Chapter 13.3, Problem 15E
Engine emissions: In a laboratory test of a new automobile engine design carried out at the Colorado School of Mines, the emission rate (in milligrams per second) of oxides of nitrogen was measured for 32 engines at various engine speeds (in rpm) and engine torque (in foot pounds) The following MINITAB output presents the multiple regression equation Emission rate
Speed
Torque.
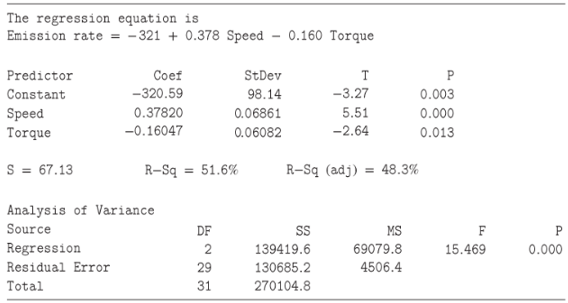
- Predict the emissions rate for an engine with speed 1500 and torque 500.
- Two engines are run at the same torque, but their speeds differ by 300 rpm. By how much should we predict their emissions rates to differ?
- Is the model useful for prediction? Explain. Use the
- How much of the variation in the emission rate is explained by the model?
- Let
- Let
Expert Solution & Answer
Want to see the full answer?
Check out a sample textbook solution
Chapter 13 Solutions
Elementary Statistics ( 3rd International Edition ) Isbn:9781260092561
Ch. 13.1 - Prob. 7ECh. 13.1 - Prob. 8ECh. 13.1 - In Exercises 9 and 10, determine whether the...Ch. 13.1 - Prob. 10ECh. 13.1 - Prob. 11ECh. 13.1 - Prob. 12ECh. 13.1 - Prob. 13ECh. 13.1 - Prob. 14ECh. 13.1 - Prob. 15ECh. 13.1 - Prob. 16E
Ch. 13.1 - Prob. 17ECh. 13.1 - Prob. 18ECh. 13.1 - Prob. 19ECh. 13.1 - Prob. 20ECh. 13.1 - Prob. 21ECh. 13.1 - Prob. 22ECh. 13.1 - Prob. 23ECh. 13.1 - Prob. 24ECh. 13.1 - Prob. 25ECh. 13.1 - Prob. 26ECh. 13.1 - Prob. 27ECh. 13.1 - Prob. 28ECh. 13.1 - Prob. 26aECh. 13.1 - Calculator display: The following TI-84 Plus...Ch. 13.1 - Prob. 28aECh. 13.1 - Prob. 29ECh. 13.1 - Prob. 30ECh. 13.1 - Confidence interval for the conditional mean: In...Ch. 13.2 - Prob. 3ECh. 13.2 - Prob. 4ECh. 13.2 - Prob. 5ECh. 13.2 - Prob. 6ECh. 13.2 - Prob. 7ECh. 13.2 - Prob. 8ECh. 13.2 - Prob. 9ECh. 13.2 - Prob. 10ECh. 13.2 - Prob. 11ECh. 13.2 - Prob. 12ECh. 13.2 - Prob. 13ECh. 13.2 - Prob. 14ECh. 13.2 - Prob. 15ECh. 13.2 - Prob. 16ECh. 13.2 - Prob. 17ECh. 13.2 - Dry up: Use the data in Exercise 26 in Section...Ch. 13.2 - Prob. 19ECh. 13.2 - Prob. 20ECh. 13.2 - Prob. 21ECh. 13.3 - Prob. 7ECh. 13.3 - Prob. 8ECh. 13.3 - Prob. 9ECh. 13.3 - In Exercises 9 and 10, determine whether the...Ch. 13.3 - Prob. 11ECh. 13.3 - Prob. 12ECh. 13.3 - Prob. 13ECh. 13.3 - For the following data set: Construct the multiple...Ch. 13.3 - Engine emissions: In a laboratory test of a new...Ch. 13.3 - Prob. 16ECh. 13.3 - Prob. 17ECh. 13.3 - Prob. 18ECh. 13.3 - Prob. 19ECh. 13.3 - Prob. 20ECh. 13.3 - Prob. 21ECh. 13.3 - Prob. 22ECh. 13.3 - Prob. 23ECh. 13 - A confidence interval for 1 is to be constructed...Ch. 13 - A confidence interval for a mean response and a...Ch. 13 - Prob. 3CQCh. 13 - Prob. 4CQCh. 13 - Prob. 5CQCh. 13 - Prob. 6CQCh. 13 - Construct a 95% confidence interval for 1.Ch. 13 - Prob. 8CQCh. 13 - Prob. 9CQCh. 13 - Prob. 10CQCh. 13 - Prob. 11CQCh. 13 - Prob. 12CQCh. 13 - Prob. 13CQCh. 13 - Prob. 14CQCh. 13 - Prob. 15CQCh. 13 - Prob. 1RECh. 13 - Prob. 2RECh. 13 - Prob. 3RECh. 13 - Prob. 4RECh. 13 - Prob. 5RECh. 13 - Prob. 6RECh. 13 - Prob. 7RECh. 13 - Prob. 8RECh. 13 - Prob. 9RECh. 13 - Prob. 10RECh. 13 - Air pollution: Following are measurements of...Ch. 13 - Icy lakes: Following are data on maximum ice...Ch. 13 - Prob. 13RECh. 13 - Prob. 14RECh. 13 - Prob. 15RECh. 13 - Prob. 1WAICh. 13 - Prob. 2WAICh. 13 - Prob. 1CSCh. 13 - Prob. 2CSCh. 13 - Prob. 3CSCh. 13 - Prob. 4CSCh. 13 - Prob. 5CSCh. 13 - Prob. 6CSCh. 13 - Prob. 7CS
Knowledge Booster


Learn more about
Need a deep-dive on the concept behind this application? Look no further. Learn more about this topic, statistics and related others by exploring similar questions and additional content below.Similar questions
- Olympic Pole Vault The graph in Figure 7 indicates that in recent years the winning Olympic men’s pole vault height has fallen below the value predicted by the regression line in Example 2. This might have occurred because when the pole vault was a new event there was much room for improvement in vaulters’ performances, whereas now even the best training can produce only incremental advances. Let’s see whether concentrating on more recent results gives a better predictor of future records. (a) Use the data in Table 2 (page 176) to complete the table of winning pole vault heights shown in the margin. (Note that we are using x=0 to correspond to the year 1972, where this restricted data set begins.) (b) Find the regression line for the data in part ‚(a). (c) Plot the data and the regression line on the same axes. Does the regression line seem to provide a good model for the data? (d) What does the regression line predict as the winning pole vault height for the 2012 Olympics? Compare this predicted value to the actual 2012 winning height of 5.97 m, as described on page 177. Has this new regression line provided a better prediction than the line in Example 2?arrow_forwardDemand for Candy Bars In this problem you will determine a linear demand equation that describes the demand for candy bars in your class. Survey your classmates to determine what price they would be willing to pay for a candy bar. Your survey form might look like the sample to the left. a Make a table of the number of respondents who answered yes at each price level. b Make a scatter plot of your data. c Find and graph the regression line y=mp+b, which gives the number of respondents y who would buy a candy bar if the price were p cents. This is the demand equation. Why is the slope m negative? d What is the p-intercept of the demand equation? What does this intercept tell you about pricing candy bars? Would you buy a candy bar from the vending machine in the hallway if the price is as indicated. Price Yes or No 50 75 1.00 1.25 1.50 1.75 2.00arrow_forwardLife Expectancy The following table shows the average life expectancy, in years, of a child born in the given year42 Life expectancy 2005 77.6 2007 78.1 2009 78.5 2011 78.7 2013 78.8 a. Find the equation of the regression line, and explain the meaning of its slope. b. Plot the data points and the regression line. c. Explain in practical terms the meaning of the slope of the regression line. d. Based on the trend of the regression line, what do you predict as the life expectancy of a child born in 2019? e. Based on the trend of the regression line, what do you predict as the life expectancy of a child born in 1580?2300arrow_forward
Recommended textbooks for you
 Functions and Change: A Modeling Approach to Coll...AlgebraISBN:9781337111348Author:Bruce Crauder, Benny Evans, Alan NoellPublisher:Cengage Learning
 Algebra and Trigonometry (MindTap Course List)AlgebraISBN:9781305071742Author:James Stewart, Lothar Redlin, Saleem WatsonPublisher:Cengage Learning
 College AlgebraAlgebraISBN:9781305115545Author:James Stewart, Lothar Redlin, Saleem WatsonPublisher:Cengage Learning
 Elementary Linear Algebra (MindTap Course List)AlgebraISBN:9781305658004Author:Ron LarsonPublisher:Cengage Learning
Functions and Change: A Modeling Approach to Coll...
Algebra
ISBN:9781337111348
Author:Bruce Crauder, Benny Evans, Alan Noell
Publisher:Cengage Learning
Algebra and Trigonometry (MindTap Course List)
Algebra
ISBN:9781305071742
Author:James Stewart, Lothar Redlin, Saleem Watson
Publisher:Cengage Learning
College Algebra
Algebra
ISBN:9781305115545
Author:James Stewart, Lothar Redlin, Saleem Watson
Publisher:Cengage Learning
Elementary Linear Algebra (MindTap Course List)
Algebra
ISBN:9781305658004
Author:Ron Larson
Publisher:Cengage Learning
Correlation Vs Regression: Difference Between them with definition & Comparison Chart; Author: Key Differences;https://www.youtube.com/watch?v=Ou2QGSJVd0U;License: Standard YouTube License, CC-BY
Correlation and Regression: Concepts with Illustrative examples; Author: LEARN & APPLY : Lean and Six Sigma;https://www.youtube.com/watch?v=xTpHD5WLuoA;License: Standard YouTube License, CC-BY