
Gen Combo Ll Applied Statistics In Business & Economics; Connect Access Card
6th Edition
ISBN: 9781260260632
Author: David Doane, Lori Seward Senior Instructor of Operations Management
Publisher: McGraw-Hill Education
expand_more
expand_more
format_list_bulleted
Concept explainers
Videos
Textbook Question
Chapter 13.3, Problem 9SE
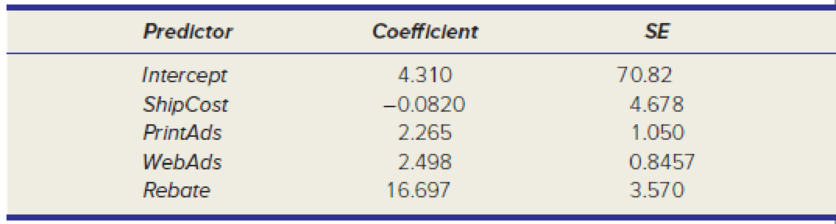
Observations are taken on net revenue from sales of a certain LCD TV at 50 retail outlets. The regression model was Y = net revenue (thousands of dollars), X1 = shipping cost (dollars per unit), X2 = expenditures on print advertising (thousands of dollars), X3 = expenditure on electronic media ads (thousands), X4 = rebate rate (percent of retail price). (a) Calculate the t statistic for each coefficient to test for β = 0. (b) Look up the critical value of Student’s t in Appendix D for a two-tailed test at α = .01. Which coefficients differ significantly from zero? (c) Use Excel to find the p-value for each coefficient.
Expert Solution & Answer
Want to see the full answer?
Check out a sample textbook solution
Students have asked these similar questions
Find the correlation coefficient given the estimated regression equation = 25+6x and ² = .8754.
Calculate the equation of the regression line and calculate the correlation coefficient
A researcher interested in explaining the level of foreign reserves for the country of Barbados
estimated the following multiple regression model using yearly data spanning the period 2001 to
2016:
FR=a+BOIL+YEXP+8FDI
Where FR = yearly foreign reserves ($000’s), OIL = annual oil prices, EXP = yearly total exports
(S000's) and FDI = annual foreign direct investment (S000's). The sample of data was processed
using MINITAB and the following is an extract of the output obtained:
Predictor
Coef
StDev
t-ratio
p-value
Constant
5491.38 2508.81
2.1888
0.0491
OIL
85.39
18.46
4.626
0.0006
EXP
-377.08
112.19
0.0057
FDI
-396.99
160.66
-2.471
**
s = 2.45
R-sq = 96.3%
R-sq (adj)
= 95.3%
Analysis of Variance
Source
DF
MS
F
Regression
3
1991.31
663.77
?
??
Error
12
77.4
6.45
Total
15
a) What is dependent and independent variables?
b) Fully write out the regression equation
c) Fill in the missing values ***, ***', ?'and ??'
d) Hence test whether ß is significant. Give reasons for your answer.
e) Perform…
Chapter 13 Solutions
Gen Combo Ll Applied Statistics In Business & Economics; Connect Access Card
Ch. 13.1 - Observations are taken on net revenue from sales...Ch. 13.1 - Observations are taken on sales of a certain...Ch. 13.1 - Prob. 3SECh. 13.1 - A regression model to predict Y, the...Ch. 13.2 - Refer to the ANOVA table below. (a) State the...Ch. 13.2 - Refer to the ANOVA table below. (a) State the...Ch. 13.2 - Prob. 7SECh. 13.2 - Refer to the ANOVA table below. (a) State the...Ch. 13.3 - Observations are taken on net revenue from sales...Ch. 13.3 - Observations are taken on sales of a certain...
Ch. 13.3 - Prob. 11SECh. 13.3 - A regression model to predict Y, the state...Ch. 13.4 - A regression of accountants starting salaries in a...Ch. 13.4 - An agribusiness performed a regression of wheat...Ch. 13.5 - Prob. 15SECh. 13.5 - A regression model to predict the price of...Ch. 13.5 - Prob. 17SECh. 13.5 - Prob. 18SECh. 13.6 - Prob. 19SECh. 13.6 - Prob. 20SECh. 13.7 - Prob. 21SECh. 13.7 - Using the Metals data, construct a correlation...Ch. 13.8 - Prob. 23SECh. 13.8 - Which violations of regression assumptions, if...Ch. 13 - (a) List two limitations of simple regression. (b)...Ch. 13 - (a) What does represent in the regression model?...Ch. 13 - Prob. 3CRCh. 13 - Prob. 4CRCh. 13 - Prob. 5CRCh. 13 - Prob. 6CRCh. 13 - Prob. 7CRCh. 13 - Prob. 8CRCh. 13 - Prob. 9CRCh. 13 - (a) State the formula for the standard error of...Ch. 13 - (a) What is a binary predictor? (b) Why is a...Ch. 13 - Prob. 12CRCh. 13 - Prob. 13CRCh. 13 - (a) What is multicollinearity? (b) What are its...Ch. 13 - Prob. 15CRCh. 13 - (a) State the formula for a variance inflation...Ch. 13 - Prob. 17CRCh. 13 - Prob. 18CRCh. 13 - Prob. 19CRCh. 13 - Prob. 20CRCh. 13 - (a) Name two ways to detect autocorrelated...Ch. 13 - (a) What is a lurking variable? How might it be...Ch. 13 - Prob. 23CRCh. 13 - Instructions for Data Sets: Choose one of the data...Ch. 13 - Note: Exercises marked are based on optional...Ch. 13 - Prob. 27CECh. 13 - Note: Exercises marked are based on optional...Ch. 13 - Note: Exercises marked are based on optional...Ch. 13 - Prob. 30CECh. 13 - Prob. 31CECh. 13 - Prob. 32CECh. 13 - Prob. 33CECh. 13 - Prob. 34CECh. 13 - Prob. 35CECh. 13 - Note: Exercises marked are based on optional...Ch. 13 - Note: Exercises marked are based on optional...Ch. 13 - Note: Exercises marked are based on optional...Ch. 13 - Prob. 39CECh. 13 - Prob. 40CECh. 13 - Prob. 41CECh. 13 - In a model of Fords quarterly revenue TotalRevenue...Ch. 13 - In a study of paint peel problems, a regression...Ch. 13 - A hospital emergency room analyzed n = 17,664...Ch. 13 - Prob. 45CECh. 13 - A researcher used stepwise regression to create...Ch. 13 - A sports enthusiast created an equation to predict...Ch. 13 - An expert witness in a case of alleged racial...Ch. 13 - Prob. 50CECh. 13 - Prob. 51CECh. 13 - Prob. 52CECh. 13 - Which statement is correct concerning one-factor...Ch. 13 - Prob. 2ERQCh. 13 - Prob. 3ERQCh. 13 - Prob. 4ERQCh. 13 - Prob. 5ERQCh. 13 - Prob. 6ERQCh. 13 - Prob. 7ERQCh. 13 - Prob. 8ERQCh. 13 - Prob. 9ERQCh. 13 - Prob. 10ERQCh. 13 - Prob. 11ERQCh. 13 - Prob. 12ERQCh. 13 - Prob. 13ERQCh. 13 - Prob. 14ERQCh. 13 - Prob. 15ERQ
Knowledge Booster


Learn more about
Need a deep-dive on the concept behind this application? Look no further. Learn more about this topic, statistics and related others by exploring similar questions and additional content below.Similar questions
- What does the y -intercept on the graph of a logistic equation correspond to for a population modeled by that equation?arrow_forwardFor the following exercises, use Table 4 which shows the percent of unemployed persons 25 years or older who are college graduates in a particular city, by year. Based on the set of data given in Table 5, calculate the regression line using a calculator or other technology tool, and determine the correlation coefficient. Round to three decimal places of accuracyarrow_forwardFind the equation of the regression line for the following data set. x 1 2 3 y 0 3 4arrow_forward
- A study was conducted to see if birth weight affects the increase in weight of a newborn betweendays 70 and 100 of life. The study recorded the birth weight (in ounces) (X) for 12 newborns and thenfollowed up to record the increase in weight between days 70 and 100, and expressed it as the percentageof the birth weight (Y). The regression line between the two variables was found to beIncrease (% of birth weight) = 256.3 −1.74 × birth weight Note: The symbol above is a stretched hat symbol to indicate ˆy. (a) Is the direction of relationship between the two variables positive or negative? What does this meanin context of the problem.(b) Interpret the slope of the regression line in context of the problem.(c) Find the predicted increase in birth weight between days 70 and 100 for a baby that weighed 95ounces at birth.arrow_forwardA trucking company considered a multiple regression model for relating the dependent variable y = total daily travel time for one of its drivers (hours) to the predictors x₁ = distance traveled (miles) and x₂ = the number of deliveries made. Suppose that the model equation is Y = -0.800+ 0.060x₁ +0.900x₂ + e (a) What is the mean value of travel time when distance traveled is 50 miles and four deliveries are made? hr (b) How would you interpret ₁ = 0.060, the coefficient of the predictor x₁? O When the number of deliveries is constant, the average change in travel time associated with a ten-mile (i.e. one unit) increase in distance traveled is 0.060 hours. O The total daily travel time increases by 0.060 hours when the distance traveled increases by 1. O When the number of deliveries is held fixed, the average change in travel time associated with a one-mile (i.e. one unit) increase in distance traveled is 0.060 hours. O The average change in travel time associated with a one-mile (i.e.…arrow_forwardThe least-squares regression equation is y=784.6x+12,431 where y is the median income and x is the percentage of 25 years and older with at least a bachelor's degree in the region. The scatter diagram indicates a linear relation between the two variables with a correlation coefficient of 0.7962. Interpret the slope.arrow_forward
- A trucking company considered a multiple regression model for relating the dependent variable y = total daily travel time for one of its drivers (hours) to the predictors x, = distance traveled (miles) and x, = the number of deliveries made. Suppose that the model equation is Y = -0.800 + 0.060x, + 0.900x2 + € (a) What is the mean value of travel time when distance traveled is 50 miles and four deliveries are made? 5.8 v hr (b) How would you interpret ß1 = 0.060, the coefficient of the predictor X1? o When the number of deliveries is held fixed, the average change in travel time associated with a one-mile (i.e. one unit) increase in distance traveled is 0.060 hours. O The total daily travel time increases by 0.060 hours when the distance traveled increases by 1. O When the number of deliveries is constant, the average change in travel time associated with a ten-mile (i.e. one unit) increase in distance traveled is 0.060 hours. O The average change in travel time associated with a…arrow_forwardA study was done to investigate the relationship between amount of protix (a new protein-vitamin•-mineral supplement) org a fortified- vitamin rice, known as FVR, and the gain in weight of children. Ten randomly chosen sections of grade one pupils were fed with FVR containing protix; different amounts X of protix were used for the 10 sections. The increase in the weight of each child was measured after a given period. The average gain Y in weight for each section with a prescribed protix level x is as follows; Section(i) Protix(X) Gain(Y) Section(i) Protix(X) Gain(Y) 1 2 3 4 5 50 60 70 80 90 91.6 96.5 95.5 101.3 104.8 6 7 8 9 10 100 110 120 130 140 105.2 107.9 107.4 109.2 109.8 Compute the prediction equation to predict the gain in the weight of a child.arrow_forwardMoisture content in percent by volume (x) and conductivity in mS/m (y) were measured for 50 soil specimens. The means and standard deviations were =8.1, s, = 1.2. 5 = 30.4, s, =1.9 . The correlation between conductivity and moisture was computed to be r = 0.85. Find the equation of the least-squares line for predicting soil conductivity from moisture content.arrow_forward
- A researcher interested in explaining the level of foreign reserves for the country of Barbados estimated the following multiple regression model using yearly data spanning the period 2001 to 2016: FR=a+B01L+YEXP+8FDI Where FR = yearly foreign reserves (So000's), OIL = annual oil prices, EXP = yearly total exports (S000's) and FDI = annual foreign direct investment ($000's). The sample of data was processed using MINITAB and the following is an extract of the output obtained: Predictor Coef StDev t-ratio p-value Constant 5491.38 2508.81 2.1888 0.0491 OIL 85.39 18.46 4.626 0.0006 EXP -377.08 112.19 0.0057 FDI -396.99 160.66 -2.471 s - 2.45 R-sq = 96.3% R-sq(adj) = 95.3% Analysis of Variance Source DF MS F Regression 3 1991.31 663.77 ?? Error 12 43. רר 6.45 Total 15 a) What is dependent and independent variables? b) Fully write out the regression equation c) Fill in the missing values **', **', '?'and *??"arrow_forwardTo estimate the value of a dependent variable based on the values of one or more independent variables, the process used is called: Correlation Regression Slope Intercept Residualarrow_forward4b) The data shows a systolic and a diastolic blood pressure of certain patients. Find the linear regression equation, using the first variable x (systolic) as the independent variable. Find the best predicted diastolic blood pressure for a patient with a systolic blood pressure (y) reading of 140. What is the correlation coefficient, r? Using a significance level of a = 0.05, is there a significant linear relationship between systolic and diastolic blood pressure? Blood Pressure: Systolic Diastolic 112 125 115 136 143 116 123 124 elimii 70 89 65 90 97 64 SUTT nisinoo aqdM 21.SS bns aqdM 78 ahoqnis erit te zbesqz steb ils to 69 bns ago 20.EI to adimil srit terit sonabilnos 2 nistnoo aqdM 21.SS bnc agdM sgsavs arit ferli mislo a hoqnis orti roqque lovedni sonsbilnos 3028 wolsd insmsisiz tomo artezorio SeqdM 2.55 al 2.SS to sulavadi znistmoodi ezusaed mish ads toqque ton zaob 2.55 to sulsy sdt anistroo ti sausosd mislo ert hoqquz 200b to sulav orit nisinoo ton zoob 11 saussed misbb adi…arrow_forward
arrow_back_ios
SEE MORE QUESTIONS
arrow_forward_ios
Recommended textbooks for you

 Glencoe Algebra 1, Student Edition, 9780079039897...AlgebraISBN:9780079039897Author:CarterPublisher:McGraw Hill
 Big Ideas Math A Bridge To Success Algebra 1: Stu...AlgebraISBN:9781680331141Author:HOUGHTON MIFFLIN HARCOURTPublisher:Houghton Mifflin Harcourt
 Functions and Change: A Modeling Approach to Coll...AlgebraISBN:9781337111348Author:Bruce Crauder, Benny Evans, Alan NoellPublisher:Cengage Learning
Glencoe Algebra 1, Student Edition, 9780079039897...
Algebra
ISBN:9780079039897
Author:Carter
Publisher:McGraw Hill
Big Ideas Math A Bridge To Success Algebra 1: Stu...
Algebra
ISBN:9781680331141
Author:HOUGHTON MIFFLIN HARCOURT
Publisher:Houghton Mifflin Harcourt
Functions and Change: A Modeling Approach to Coll...
Algebra
ISBN:9781337111348
Author:Bruce Crauder, Benny Evans, Alan Noell
Publisher:Cengage Learning
Correlation Vs Regression: Difference Between them with definition & Comparison Chart; Author: Key Differences;https://www.youtube.com/watch?v=Ou2QGSJVd0U;License: Standard YouTube License, CC-BY
Correlation and Regression: Concepts with Illustrative examples; Author: LEARN & APPLY : Lean and Six Sigma;https://www.youtube.com/watch?v=xTpHD5WLuoA;License: Standard YouTube License, CC-BY