
Gen Combo Ll Applied Statistics In Business & Economics; Connect Access Card
6th Edition
ISBN: 9781260260632
Author: David Doane, Lori Seward Senior Instructor of Operations Management
Publisher: McGraw-Hill Education
expand_more
expand_more
format_list_bulleted
Concept explainers
Videos
Textbook Question
Chapter 13, Problem 46CE
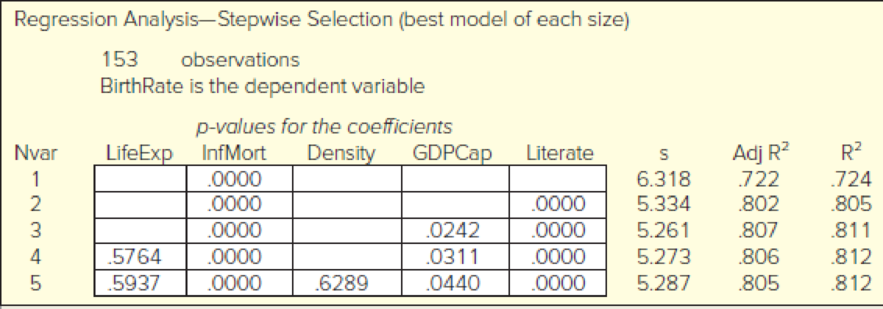
A researcher used stepwise regression to create regression models to predict BirthRate (births per 1,000) using five predictors: LifeExp (life expectancy in years), InfMort (infant mortality rate), Density (population density per square kilometer), GDPCap (gross domestic product per capita), and Literate (literacy percent). (a) Which model (Nvar 1, 2, 3, 4, or 5) best balances fit and parsimony? Explain. (b) Does the addition of LifeExp and Density improve the model with respect to the R2adj? (c) Which two variables appear to be the most significant?  BirthRates2
Expert Solution & Answer
Want to see the full answer?
Check out a sample textbook solution
Students have asked these similar questions
A researcher interested in explaining the level of foreign reserves for the country of Barbadosestimated the following multiple regression model using yearly data spanning the period 2001 to 2016: ??=?+????+????+????Where FR = yearly foreign reserves ($000’s), OIL = annual oil prices, EXP = yearly total exports ($000’s) and FDI = annual foreign direct investment ($000’s). The sample of data was processed using MINITAB and the following is an extract of the output obtained:Predictor Coef StDev t-ratio p-value Constant 5491.38 2508.81 2.1888 0.0491OIL 85.39 18.46 4.626 0.0006EXP -377.08 112.19 * 0.0057FDI -396.99 160.66 -2.471 ** S = 2.45 R-sq = 96.3% R-sq(adj) = 95.3%Analysis of VarianceSource DF SS MS F pRegression 3 1991.31 663.77 ? ??Error 12 77.4 6.45Total 15
Perform the F Test making sure to state the null and alternative hypothesis. f) Given an interpretation of the term “R-sq” and comment on its value.
A 10-year study conducted by the American Heart Association provided data on how age, blood pressure, and smoking relate to the risk of strokes (Dataset "Stroke"). Risk is interpreted as the probability (times 100) that a person will have a stroke over the next 10-year period. For the smoker variable, 1 indicates a smoker and 0 indicates a nonsmoker.
a. Develop an estimated regression equation that can be used to predict the risk of stroke given the age and blood-pressure level.
b. Consider adding two independent variables to the model developed in part (a), one for the interaction between age and blood-pressure level and the other for whether the person is a smoker. Develop an estimated regression equation using these four independent variables.
c. At a 0.05 level of significance, test to see whether the addition of the interaction term and the smoker variable contributes significantly to the estimated regression equation developed in part (a).
d. Refer to the model developed in part…
when a regression is used as a method of predicting dependent variables from one or more independent variables. How are the independent variables different from each other yet related to the dependent variable?
Chapter 13 Solutions
Gen Combo Ll Applied Statistics In Business & Economics; Connect Access Card
Ch. 13.1 - Observations are taken on net revenue from sales...Ch. 13.1 - Observations are taken on sales of a certain...Ch. 13.1 - Prob. 3SECh. 13.1 - A regression model to predict Y, the...Ch. 13.2 - Refer to the ANOVA table below. (a) State the...Ch. 13.2 - Refer to the ANOVA table below. (a) State the...Ch. 13.2 - Prob. 7SECh. 13.2 - Refer to the ANOVA table below. (a) State the...Ch. 13.3 - Observations are taken on net revenue from sales...Ch. 13.3 - Observations are taken on sales of a certain...
Ch. 13.3 - Prob. 11SECh. 13.3 - A regression model to predict Y, the state...Ch. 13.4 - A regression of accountants starting salaries in a...Ch. 13.4 - An agribusiness performed a regression of wheat...Ch. 13.5 - Prob. 15SECh. 13.5 - A regression model to predict the price of...Ch. 13.5 - Prob. 17SECh. 13.5 - Prob. 18SECh. 13.6 - Prob. 19SECh. 13.6 - Prob. 20SECh. 13.7 - Prob. 21SECh. 13.7 - Using the Metals data, construct a correlation...Ch. 13.8 - Prob. 23SECh. 13.8 - Which violations of regression assumptions, if...Ch. 13 - (a) List two limitations of simple regression. (b)...Ch. 13 - (a) What does represent in the regression model?...Ch. 13 - Prob. 3CRCh. 13 - Prob. 4CRCh. 13 - Prob. 5CRCh. 13 - Prob. 6CRCh. 13 - Prob. 7CRCh. 13 - Prob. 8CRCh. 13 - Prob. 9CRCh. 13 - (a) State the formula for the standard error of...Ch. 13 - (a) What is a binary predictor? (b) Why is a...Ch. 13 - Prob. 12CRCh. 13 - Prob. 13CRCh. 13 - (a) What is multicollinearity? (b) What are its...Ch. 13 - Prob. 15CRCh. 13 - (a) State the formula for a variance inflation...Ch. 13 - Prob. 17CRCh. 13 - Prob. 18CRCh. 13 - Prob. 19CRCh. 13 - Prob. 20CRCh. 13 - (a) Name two ways to detect autocorrelated...Ch. 13 - (a) What is a lurking variable? How might it be...Ch. 13 - Prob. 23CRCh. 13 - Instructions for Data Sets: Choose one of the data...Ch. 13 - Note: Exercises marked are based on optional...Ch. 13 - Prob. 27CECh. 13 - Note: Exercises marked are based on optional...Ch. 13 - Note: Exercises marked are based on optional...Ch. 13 - Prob. 30CECh. 13 - Prob. 31CECh. 13 - Prob. 32CECh. 13 - Prob. 33CECh. 13 - Prob. 34CECh. 13 - Prob. 35CECh. 13 - Note: Exercises marked are based on optional...Ch. 13 - Note: Exercises marked are based on optional...Ch. 13 - Note: Exercises marked are based on optional...Ch. 13 - Prob. 39CECh. 13 - Prob. 40CECh. 13 - Prob. 41CECh. 13 - In a model of Fords quarterly revenue TotalRevenue...Ch. 13 - In a study of paint peel problems, a regression...Ch. 13 - A hospital emergency room analyzed n = 17,664...Ch. 13 - Prob. 45CECh. 13 - A researcher used stepwise regression to create...Ch. 13 - A sports enthusiast created an equation to predict...Ch. 13 - An expert witness in a case of alleged racial...Ch. 13 - Prob. 50CECh. 13 - Prob. 51CECh. 13 - Prob. 52CECh. 13 - Which statement is correct concerning one-factor...Ch. 13 - Prob. 2ERQCh. 13 - Prob. 3ERQCh. 13 - Prob. 4ERQCh. 13 - Prob. 5ERQCh. 13 - Prob. 6ERQCh. 13 - Prob. 7ERQCh. 13 - Prob. 8ERQCh. 13 - Prob. 9ERQCh. 13 - Prob. 10ERQCh. 13 - Prob. 11ERQCh. 13 - Prob. 12ERQCh. 13 - Prob. 13ERQCh. 13 - Prob. 14ERQCh. 13 - Prob. 15ERQ
Knowledge Booster


Learn more about
Need a deep-dive on the concept behind this application? Look no further. Learn more about this topic, statistics and related others by exploring similar questions and additional content below.Similar questions
- What does the y -intercept on the graph of a logistic equation correspond to for a population modeled by that equation?arrow_forwardDoes Table 1 represent a linear function? If so, finda linear equation that models the data.arrow_forwardOlympic Pole Vault The graph in Figure 7 indicates that in recent years the winning Olympic men’s pole vault height has fallen below the value predicted by the regression line in Example 2. This might have occurred because when the pole vault was a new event there was much room for improvement in vaulters’ performances, whereas now even the best training can produce only incremental advances. Let’s see whether concentrating on more recent results gives a better predictor of future records. (a) Use the data in Table 2 (page 176) to complete the table of winning pole vault heights shown in the margin. (Note that we are using x=0 to correspond to the year 1972, where this restricted data set begins.) (b) Find the regression line for the data in part ‚(a). (c) Plot the data and the regression line on the same axes. Does the regression line seem to provide a good model for the data? (d) What does the regression line predict as the winning pole vault height for the 2012 Olympics? Compare this predicted value to the actual 2012 winning height of 5.97 m, as described on page 177. Has this new regression line provided a better prediction than the line in Example 2?arrow_forward
- It is one question on two page. Please do itarrow_forwardDefine a qualitative regression model for a survey question where four gender options have been mentioned - Male, Female, Neither Male/Female, Don't want to disclose. Define baseline of this model.arrow_forwardA researcher interested in explaining the level of foreign reserves for the country of Barbados estimated the following multiple regression model using yearly data spanning the period 2001 to 2016: FR=a+BOIL+yEXP+8FDI Where FR = yearly foreign reserves ($000's), OIL = annual oil prices, EXP = yearly total exports ($000's) and FDI = annual foreign direct investment ($000's). The sample of data was processed using MINITAB and the following is an extract of the output obtained: Predictor Сoef StDev t-ratio p-value Constant 5491.38 2508.81 2.1888 0.0491 OIL 85.39 18.46 4.626 0.0006 EXP -377.08 112.19 0.0057 FDI -396.99 160.66 -2.471 ** S = 2.45 R-sq 96.3% R-sq (adj) 95.3% Analysis of Variance Source DF MS F Regression 1991.31 663.77 ?? Error 12 77.4 6.45 Total 15 a) What is dependent and independent variables? b) Fully write out the regression equation c) Fill in the missing values *', ***', '?'and ??' d) Hence test whether B is significant. Give reasons for your answer. e) Perform the F…arrow_forward
- A researcher interested in explaining the level of foreign reserves for the country of Barbados estimated the following multiple regression model using yearly data spanning the period 2001 to 2016: FR=a+B01L+YEXP+8FDI Where FR = yearly foreign reserves (So000's), OIL = annual oil prices, EXP = yearly total exports (S000's) and FDI = annual foreign direct investment ($000's). The sample of data was processed using MINITAB and the following is an extract of the output obtained: Predictor Coef StDev t-ratio p-value Constant 5491.38 2508.81 2.1888 0.0491 OIL 85.39 18.46 4.626 0.0006 EXP -377.08 112.19 0.0057 FDI -396.99 160.66 -2.471 s - 2.45 R-sq = 96.3% R-sq(adj) = 95.3% Analysis of Variance Source DF MS F Regression 3 1991.31 663.77 ?? Error 12 43. רר 6.45 Total 15 a) What is dependent and independent variables? b) Fully write out the regression equation c) Fill in the missing values **', **', '?'and *??"arrow_forwardExplain which characteristic of the STA leads to a consideration of a logistic model as opposed to a linear regression mode.arrow_forwardDevelop an estimated multiple linear regression model that could be used to predict the alumni giving rate using Graduation Rate, % of Classes Under 20, and Student/Faculty Ratio as independent variables. Discuss your findings.arrow_forward
- What is regression models?arrow_forwardA researcher interested in explaining the level of foreign reserves for the country of Barbados estimated the following multiple regression model using yearly data spanning the period 2001 to 2016: ??=?+????+????+???? Where FR = yearly foreign reserves ($000’s), OIL = annual oil prices, EXP = yearly total exports ($000’s) and FDI = annual foreign direct investment ($000’s). Predictor Coef StDev t-ratio p-value Constant 5491.38 2508.81 2.1888 0.0491 OIL 85.39 18.46 4.626 0.0006 EXP -377.08 112.19 -3.3611 0.0057 FDI -396.99 160.66 -2.471 0.0000 S =2.45 R-sq = 96.3% R-sq (adj) = 95.3% Analysis of Variance Source DF…arrow_forwardA researcher interested in explaining the level of foreign reserves for the country of Barbados estimated the following multiple regression model using yearly data spanning the period 2001 to 2016: ??=?+????+????+???? Where FR = yearly foreign reserves ($000’s), OIL = annual oil prices, EXP = yearly total exports ($000’s) and FDI = annual foreign direct investment ($000’s). Predictor Coef StDev t-ratio p-value Constant 5491.38 2508.81 2.1888 0.0491 OIL 85.39 18.46 4.626 0.0006 EXP -377.08 112.19 -3.361 0.0057 FDI -396.99 160.66 -2.471 ** S =2.45 R-sq = 96.3% R-sq (adj) = 95.3% (a) Fill in the missing values ‘**’, and ‘??’ (b) Hence test…arrow_forward
arrow_back_ios
SEE MORE QUESTIONS
arrow_forward_ios
Recommended textbooks for you
 Linear Algebra: A Modern IntroductionAlgebraISBN:9781285463247Author:David PoolePublisher:Cengage Learning
 College AlgebraAlgebraISBN:9781305115545Author:James Stewart, Lothar Redlin, Saleem WatsonPublisher:Cengage Learning
 Glencoe Algebra 1, Student Edition, 9780079039897...AlgebraISBN:9780079039897Author:CarterPublisher:McGraw Hill
 Algebra and Trigonometry (MindTap Course List)AlgebraISBN:9781305071742Author:James Stewart, Lothar Redlin, Saleem WatsonPublisher:Cengage Learning
 Elementary Linear Algebra (MindTap Course List)AlgebraISBN:9781305658004Author:Ron LarsonPublisher:Cengage Learning
Linear Algebra: A Modern Introduction
Algebra
ISBN:9781285463247
Author:David Poole
Publisher:Cengage Learning
College Algebra
Algebra
ISBN:9781305115545
Author:James Stewart, Lothar Redlin, Saleem Watson
Publisher:Cengage Learning
Glencoe Algebra 1, Student Edition, 9780079039897...
Algebra
ISBN:9780079039897
Author:Carter
Publisher:McGraw Hill
Algebra and Trigonometry (MindTap Course List)
Algebra
ISBN:9781305071742
Author:James Stewart, Lothar Redlin, Saleem Watson
Publisher:Cengage Learning
Elementary Linear Algebra (MindTap Course List)
Algebra
ISBN:9781305658004
Author:Ron Larson
Publisher:Cengage Learning
Correlation Vs Regression: Difference Between them with definition & Comparison Chart; Author: Key Differences;https://www.youtube.com/watch?v=Ou2QGSJVd0U;License: Standard YouTube License, CC-BY
Correlation and Regression: Concepts with Illustrative examples; Author: LEARN & APPLY : Lean and Six Sigma;https://www.youtube.com/watch?v=xTpHD5WLuoA;License: Standard YouTube License, CC-BY