
Videos
Wilcoxon Rank-Sum Test. In Exercises 5–8, use the Wilcoxon rank-sum test.
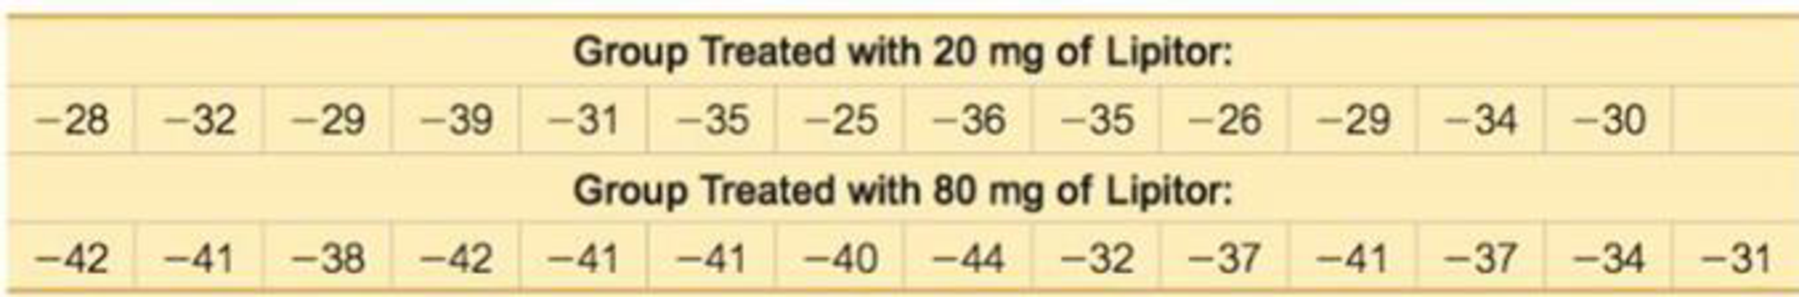
7. Clinical Trials of Lipitor The sample data below are changes in LDL cholesterol levels in clinical trials of Lipitor (atorvastatin). It was claimed that Lipitor had an effect on LDL cholesterol. (The data are based on results given in a Parke-Davis memo from David G. Orloff, M.D., the medical team leader for clinical trials of Lipitor. Pfizer declined to provide the author with the original data values.) Negative values represent decreases in LDL cholesterol. Use a 0.05 significance level to test the claim that for those treated with 20 mg of Lipitor and those treated with 80 mg of Lipitor, changes in LDL cholesterol have the same median. What do the results suggest?
Want to see the full answer?
Check out a sample textbook solution
Chapter 13 Solutions
Elementary Statistics (13th Edition)


- use the Wilcoxon rank-sum test. Clinical Trials of Lipitor The sample data below are changes in LDL cholesterol levels in clinical trials of Lipitor (atorvastatin). It was claimed that Lipitor had an effect on LDL cholesterol. (The data are based on results given in a Parke-Davis memo from David G. Orloff, M.D., the medical team leader for clinical trials of Lipitor. Pfizer declined to provide die author with the original data values.) Negative values represent decreases in LDL cholesterol. Use a 0.05 significance level to test the claim that for those treated with 20 mg of atorvastatin and those treated widi 80 mg of atorvastatin, changes in LDL cholesterol have the same median. What do the results suggest? Group treated with 20 mg of atorvastatin: −28 −32 −29 −39 −31 −35 −25 −36 −35 −26 −29 −34 −30 Group treated with 80 mg of atorvastatin: −42 −41 −38 −42 −41 −41 −40 −44 −32 −37 −41 −37 −34 −31arrow_forward9.1 Hematology The data in Table 9.5 are given for 9 patients with aplastic anemia. Table 9.5 Hematologic data for patients with aplastic anemia. patient number % Reticulocytes Lymphocytes ( per mm2) 1 3.6 1700 2 2.0 3078 3 0.3 1820 4 0.3 2706 5 0.2 2086 6 3.0 2299 7 0.0 676 8 1.0 2088 9 2.2 2013 Use R command fit = lm(y~x) to perform the simple linear regression, where use the command y = c(1700,…,2013) to assign the number of lymphocytes to y and x= c(3.6,…,2.2) to assign the percentage of reticulocytes to x. Use summary(fit) to generate the result of linear regression and paste it on your answer sheet. Based on the summary result of linear regression answer the following questions: (1) Test for the statistical significance of the regression line using the t test. (2) What are the standard errors of the slope and intercept for the regression line? (3) Calculate Pearson correlation coefficient by hand or by R command.arrow_forwardan attempt to develop a model of wine quality as judged by wine experts, data on alcohol content and wine quality was collected from variants of a particular wine. From a sample of 12wines, a model was created using the percentages of alcohol to predict wine quality. For those data, SR=18,671 and SST=27,382.Use this information to complete parts (a) through (c) below. Please complete part 3(B) ONLY. Question content area bottom Part 1 a. Determine the coefficient of determination, r2, and interpret its meaning. r2=0.682 (Round to three decimal places as needed.) Part 2 Interpret the meaning of r2. It means that 68.2 of the variation in wine quality can be explained by the variation in alcohol content. (Round to one decimal place as needed.) Part 3 b. Determine the standard error of the estimate. SYX= (Round to four decimal places as needed.)arrow_forward
- 9.1 Hematology The data in Table 9.5 are given for 9 patients with aplastic anemia. Table 9.5 Hematologic data for patients with aplastic anemia. patient number % Reticulocytes Lymphocytes ( per mm2) 1 3.6 1700 2 2.0 3078 3 0.3 1820 4 0.3 2706 5 0.2 2086 6 3.0 2299 7 0.0 676 8 1.0 2088 9 2.2 2013 Use R command fit = lm(y~x) to perform the simple linear regression, where use the command y = c(1700,…,2013) to assign the number of lymphocytes to y and x= c(3.6,…,2.2) to assign the percentage of reticulocytes to x. Use summary(fit) to generate the result of linear regression and paste it on your answer sheet. Based on the summary result of linear regression answer the following questions: (1) What is the estimated regression line? (2) Test for the statistical significance of this regression line using the F test (Use the summary result from R to calculate the F test statistics and p-value). (3) What is R^2 for the regression line and how to interpret it? (4) Test…arrow_forwardYou perform an ANOVA to test that there are no main effects of factor A, no main effects of factor B, and no interaction between factors A and B. Some of the results are presented in the following ANOVA table. Source Between treatments Factor A Factor B A X B interaction Within treatments Total ANOVA Table SS 6.5667 0.0667 12.1667 df 5 29 MS 4.0333 1.2334 F 17.29 5.29 Work through the following steps to complete the preceding ANOVA table. 1. The main effect for factor A evaluates the mean differences between the levels of factor A. The main effect for factor B evaluates the mean differences between the levels of factor B. Select the correct values for the sums of squares for factors A and B in the ANOVA table. 2. Select the correct value for the within-treatments sum of squares in the ANOVA table. 3. Select the correct degrees of freedom for all the sums of squares in the ANOVA table. 4. Select the correct values for the mean square due to A X B interaction, the within treatments mean…arrow_forwardStatistics students in Oxnard College sampled 11 textbooks in the Condor bookstore, and recorded the number of pages in each textbook and its cost. The bivariate data is shown below, Number of Pages (x) Cost(y) 962 93.96 246 25.68 803 62.24 907 80.56 640 68.2 944 77.52 847 78.76 919 71.52 591 59.28 393 47.44 476 42.08 A student calculates a linear model (Please show your answers to two decimal places) Use the model above to estimate the cost when number of pages is 955 Cost - $ (Please show your answer to 2 decimal places.) Submit Question F5 F6 F7 F8 F9 F3arrow_forward
- Statistics students in Oxnard College sampled 11 textbooks in the Condor bookstore and recorded the number of pages in each textbook and its cost. The bivariate data are shown below: Number of Pages (x) Cost(y) 745 66.15 882 62.74 845 54.15 833 62.31 573 49.11 413 24.91 318 35.26 712 58.84 960 63.2 564 40.48 921 68.47 A student calculates a linear model (Please show your answers to two decimal places) Use the model to estimate the cost when number of pages is 272. Cost = $ (Please show your answer to 2 decimal places.)arrow_forwardTrace metals in drinking water affect the flavor and an unusually high concentration can pose a health hazard. Ten pairs of data were taken measuring zinc concentration in bottom water and surface water of a water source. Zinc Zinc concentration concentration in bottom Location in surface water water 1 .430 .415 .266 .238 3 .567 .390 4 .531 .410 .707 .605 .716 .609 7 .651 .632 8 .589 .523 .469 .411 10 .723 .612 Do the data support that the zinc concentration is less on the surface than the bottom of the water source, at the a = 0.1 level of significance? Note: A normal probability plot of difference in zinc concentration between the bottom and surface of water indicates the population could be normal and a boxplot indicated no outliers. a. Express the null and alternative hypotheses in symbolic form for this claim. Assume Ha = H1 – 12, where li is the population mean zinc concentration in the bottom of water and 42 is the mean zinc concentration in the surface of water. Ho: Ha Select…arrow_forwardData in the following example are selected from a larger experiment on the use of drugs in the treatment of leprosy (Snedecor and Cochran 1967). Variables in the study are as follows: Drug two antibiotics (A and D) and a control (F) Pre-Treatment (X) a pretreatment score of leprosy bacilli Post-Treatment (Y) a posttreatment score of leprosy bacilli Ten patients are selected for each drug treatment, and six sites on each patient are measured for leprosy bacilli. The covariate (a pretreatment score) is included in the model for increased precision in determining the effect of drug treatments on the posttreatment count of bacilli. An Control Earrow_forward
- Caffeine in Soft Drinks Listed below are measured amounts of caffeine (mg per 12oz of drink) obtained in one can from each of 20 brands (7-UR A&W Root Beer, Cherry Coke, …, Tab). Are the statistics representative of the population of all cans of the same 20 brands consumed by Americans?arrow_forwardTreating Chronic Fatigue Syndrome: Patients with chronic fatigue syndrome were tested, and then retested after being treated with fludrocortisones. Listed below are the changes in fatigue after the treatment (based on data from “The Relationship Between Neurally Mediated Hypotension and the Chronic Fatigue Syndrome” by Bou-Holaigah, Rowe, Kan, and Calkins, Journal of the American Medical Association, 274, No. 12). A standard scale from -7 to +7 was used, with positive values representing improvements. Use a 0.05 significance level to test the claim that the mean change is not zero. Does the treatment appear to be effective? 6 5 0 5 6 7 3 3 2 6 5 5 0 6 3 4 3 7 0 4 4 Hypotheses: __________________________________________________________________________________ P-value: ____________________ Conclusion on null hypothesis: Conclusion on claim and answer to the question:arrow_forwarded weight (in kg) and total serum cholesterol (TSC in mg/dl) data for five men (n = 5). They tested for association between weight and TSC at 5% level of significance. weight, X TSC, Y X*X Y*Y X*Y 37 2.9 1369 8.41 107.3 50 0.7 2500 0.49 35.0 67 3.3 4489 10.89 221.1 70 4.2 4900 17.64 294.0 57 3.8 3249 14.44 216.6 SUM: 281 14.9 16507 51.87 874.0 What are the Null and Alternate hypotheses for this test? Clearly label your answers as HỌ or H1. (Do not use a numerical format. Both of your statements must be in sentence form, and say something about the weightarrow_forward
 Linear Algebra: A Modern IntroductionAlgebraISBN:9781285463247Author:David PoolePublisher:Cengage Learning
 Glencoe Algebra 1, Student Edition, 9780079039897...AlgebraISBN:9780079039897Author:CarterPublisher:McGraw Hill