
Subpart (a):
Calculate the marginal cost, average total cost , variable cost and total cost.
Subpart (a):
Explanation of Solution
Table -1 shows the value of the
Table -1
| Quantity | Average variable cost |
| 1 | 1 |
| 2 | 2 |
| 3 | 3 |
| 4 | 4 |
| 5 | 5 |
| 6 | 6 |
The variable cost can be calculated by using the following formula:
Substitute the respective values in Equation (1) to calculate the variable cost.
Thus, the variable cost is $1.
Table -2 shows the value of the variable cost obtained by using Equation (1).
Table -2
| Quantity | Average variable cost | Variable cost |
| 1 | 1 | 1 |
| 2 | 2 | 4 |
| 3 | 3 | 9 |
| 4 | 4 | 16 |
| 5 | 5 | 25 |
| 6 | 6 | 36 |
The total cost can be calculated by using the following formula:
Substitute the respective values in Equation (2) to calculate the total cost.
Thus, the total cost is $17.
Table -3 shows the value of the total cost obtained by using Equation (2).
Table – 3
| Quantity | Average variable cost | Variable cost | Total cost |
| 1 | 1 | 1 | 17 |
| 2 | 2 | 4 | 20 |
| 3 | 3 | 9 | 25 |
| 4 | 4 | 16 | 32 |
| 5 | 5 | 25 | 41 |
| 6 | 6 | 36 | 52 |
The marginal cost can be calculated by using the following formula:
Substitute the respective values in Equation (3) to calculate the marginal cost.
Thus, the marginal cost is $3.
Table -4 shows the value of the marginal cost obtained by using Equation (3).
Table -4
| Quantity | Average variable cost | Variable cost | Total cost | Marginal cost |
| 1 | 1 | 1 | 17 | – |
| 2 | 2 | 4 | 20 | 3 |
| 3 | 3 | 9 | 25 | 5 |
| 4 | 4 | 16 | 32 | 7 |
| 5 | 5 | 25 | 41 | 9 |
| 6 | 6 | 36 | 52 | 11 |
The average total cost can be calculated by using the following formula:
Substitute the respective values in Equation (4) to calculate the average total cost.
Thus, the average total cost is $17.
Table -5 shows the value of the average total cost obtained by using Equation (4).
Table -5
| Quantity | Average variable cost | Variable cost | Total cost | Marginal cost | Average total cost |
| 1 | 1 | 1 | 17 | – | 17 |
| 2 | 2 | 4 | 20 | 3 | 10 |
| 3 | 3 | 9 | 25 | 5 | 8.33 |
| 4 | 4 | 16 | 32 | 7 | 8 |
| 5 | 5 | 25 | 41 | 9 | 8.20 |
| 6 | 6 | 36 | 52 | 11 | 8.67 |
Concept introduction:
Marginal cost: Marginal cost refers to the additional cost incurred from producing one more additional unit of output.
Average total cost: The average total cost is the total cost per unit of the output produced by a firm.
Average variable cost: Average variable cost refers to the variable cost per unit.
Average total cost: Average total cost refers to the total cost per unit.
Subpart (b):
Total supply in the market.
Subpart (b):
Explanation of Solution
Suppose the equilibrium price is $10, then the firm will produce 5 units of the output because the market price exceeds the marginal cost at 5th unit. Since, there are 100 firms entering the market, the quantity supplied in the market is 500 units
Concept introduction:
Supply: Supply refers to the total value of the goods and services that are available for the purchase at a particular price in a given period of time.
Subpart (c):
Long run profit.
Subpart (c):
Explanation of Solution
In the long-run, a firm can enter or exit the market. In this transition, when a firm enters the market, price will still fall at the minimum average total cost. Since the market price is $10, which is higher than the minimum of the average total cost of $8. So, the new firm’s entry will result in a decrease in the price level. When the price decreases, the quantity demand will increase. Also, the quantity of the supply decreases because the newly entered firm will continue to produce only when the price equals the average total cost. So, beyond that equilibrium state the firm will produce zero
Concept introduction:
Long run: Thelong run refers to the time, which changes the production variable to adjust to the market situation.
Subpart (d):
Long run supply.
Subpart (d):
Explanation of Solution
Figure – 1 shows the long-run supply curve for the market.
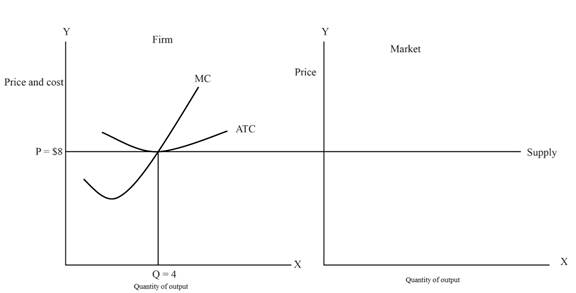
From the above figure, the x-axis represents the quantity of output and the y-axis represents the price and cost.
Concept introduction:
Supply: Supply refers to the total value of the goods and services that are available for the purchase at a particular price in a given period of time.
Want to see more full solutions like this?
Chapter 14 Solutions
Principles of Microeconomics

- Suppose the competitive tablet market is in long-run equilibrium. If at this equilibrium, the typical firm produces 20,000 tablets per month, total costs for this production are $1,800,000, and the minimum of the average variable costs is $70, what price will Instructions: Enter your responses as a whole number. a. induce entry into the market? When the price rises above $ b. cause firms to shut down production in the short run?arrow_forwardConsider the attached diagram of a competitive market and the typical firm operating in that market. In the long run, what total amount of the product will be supplied in equilibrium? [Hint: what amount do consumers demand at the long-run price?] Price 28 24 20 500,000 700,000 D Price, costs 60 66 78 MC ACarrow_forwardAssume that a firm in a competitive market faces the following cost information. If the market price for this firm's product is $40, calculate the profit maximizing level of output for this firm using marginal analysis. It may help to create your own cost table and fill in columns for Marginal Cost and Average Total Cost based on the Total Cost information below. a.What is the level of profit for this firm at the profit maximizing output? b.To convince yourself that the quantity you found is indeed the profit maximizing quantity, try calculating what the profit would be at the next higher level of output. What did you find? c. What do you predict will happen in this market over the long run?arrow_forward
- In Problem 5, the market demand decreases and the demand schedule becomes: If firms have the same costs set out in Problem 5, what is the market price and the firm’s economic profit or loss in the short run? Problem 5 The market for paper is perfectly competitive and 1,000 firms produce paper. The table sets out the market demand schedule for paper. The table in the next column sets out the costs of each producer of paper. Calculate the market price, the market output, the quantity produced by each firm, and the firm’s economic profit or loss.arrow_forwardThe soybean industry is a constant cost industry. A new study revealing negative health effects of soymilk permanently decreases the number of buyers in the soybean market. Due to the decrease in demand, the equilibrium price of soybeans ______ in the long run, the equilibrium quantity of soybeans ______in the long run, and the number of firms in the market will _____ in the long run. Word Bank: Decreases, Decreases, Decreases, Increases, Increases, Increases, does not change, does not change, does not change.arrow_forwardAssume that the market for pasta is in long-run equilibrium and that the pasta industry is a constant-cost industry. Explain with a graph and words what will happen to the price and quantity in the market when the demand for pasta decreases.arrow_forward
- What will happen to the demand curve for this toilet company in the long run? Describe two things that will happen to the demand curve. How much is the long run equilibrium quantity and price?arrow_forwardThe pen industry is an increasing cost industry. If a pen is an inferior good, and consumer's incomes permanently increase, the equilibrium price of a pen ____ in the long run, the equilibrium quantity of pens ______in the long run, and the number of firms in the market ____ in the long run. Word Bank: Decreases, Decreases, Decreases, Increases, Increases, Increases, does not change, does not change, does not change.arrow_forwardSuppose that the market for dress shirts is a perfectly competitive market. The following graph shows the daily cost curves of a firm operating in this market. 50 45 Profit or Loss 40 35 30 ATC 25 20 AVC 10 MC 0. 4. 10 12 14 16 18 QUANTITY (Thousands of shirts) In the short run, at a market price of $15 per shirt, this firm will choose to produce shirts per day. 20 15 PRICE (Dollars per shirt)arrow_forward
- 31) What is total fixed cost at the profit-maximizing quantity? 32) When the process of entry and exit has ended in a competitive market, are firms’ profits positive, negative, or zero? Why is this true? 33) When a single firm can supply a good or service to an entire market at a lower cost than could two or more firms, the industry is known as a?arrow_forwardAssume that a firm in a competitive market faces the following cost information. If the market price for this firm's product is $40, calculate the profit maximizing level of output for this firm using marginal analysis. a.Approximately where do you think the price will end up in this market over the long run? b.Last, instead of assuming a given price, how would you go about finding the equilibrium price if you were given information on market demand?arrow_forwardA profit-maximizing firm in a competitive market is currently producing and selling 1000 units of output. It has an average revenue of $13, and an average cost of $8. What is its marginal revenue? How much economic profit does it make? Given the firm's economic profit, what is expected to happen in terms of market supply, and equilibrium price and quantity? Why?arrow_forward
 Essentials of Economics (MindTap Course List)EconomicsISBN:9781337091992Author:N. Gregory MankiwPublisher:Cengage Learning
 Microeconomics: Private and Public Choice (MindTa...EconomicsISBN:9781305506893Author:James D. Gwartney, Richard L. Stroup, Russell S. Sobel, David A. MacphersonPublisher:Cengage Learning
 Economics: Private and Public Choice (MindTap Cou...EconomicsISBN:9781305506725Author:James D. Gwartney, Richard L. Stroup, Russell S. Sobel, David A. MacphersonPublisher:Cengage Learning
 Exploring EconomicsEconomicsISBN:9781544336329Author:Robert L. SextonPublisher:SAGE Publications, Inc
 Principles of Economics, 7th Edition (MindTap Cou...EconomicsISBN:9781285165875Author:N. Gregory MankiwPublisher:Cengage Learning