
Videos
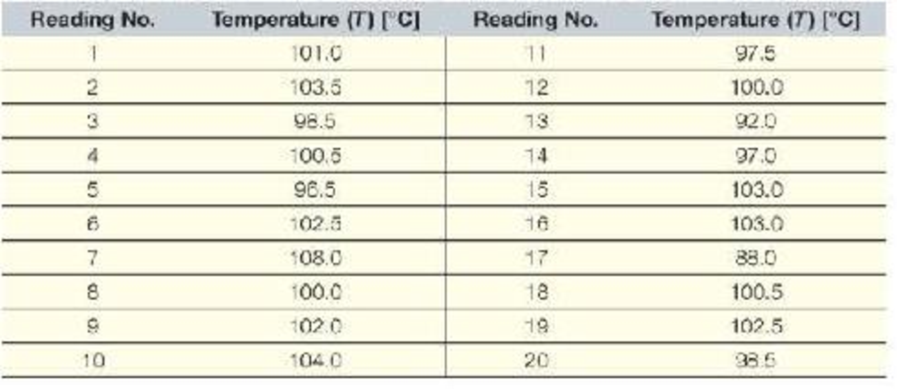
The following data were collected from a manufacturing process involving reactor temperature measured in degrees Celsius. The following values are desired: average = 100 degrees Celsius; standard deviation = ±5 degrees Celsius.
Graph the data on a control chart. A blank god has been provided online; you may use this god or use graph paper as directed by your instructor. Be sure to clearly indicate the zones of control
Using the eight SPC rules, determine whether the process is in statistical control. If it is not 10 statistical control, indicate which rule or rules are violated and list the part numbers that violate those rules
Want to see the full answer?
Check out a sample textbook solution
Chapter 14 Solutions
THINKING LIKE AN ENGINEER W/ACCESS
Additional Engineering Textbook Solutions
Mechanics of Materials
DESIGN OF MACHINERY
Thermodynamics: An Engineering Approach
Introduction To Finite Element Analysis And Design
HEAT+MASS TRANSFER:FUND.+APPL.
Applied Fluid Mechanics (7th Edition)


- Pressure distribution measurements are made on a two-dimensional wing model placed in a wind tunnel. The difference between the static pressure sockets on the surface and the static pressure of the free stream is measured. 30 data is taken at each measurement point. The average of the values measured from one of the sockets near the trailing edge was calculated as 2.30 Pa, and the standard deviation was calculated as 2.65 Pa. After applying the Chauvenet criterion to these measurement values, it was decided to eliminate 3 measurements and the new mean value was found to be 2.18 Pa and the standard deviation was 2.42. It was verified that the unexcluded data fit the normal distribution curve. Data above how many Pa and below how many Pa were eliminated? Estimate how many data have negative value (?<0) after elimination.arrow_forwardPLEASE WRITE CLEARLY! I OFTEN CAN NOT DECIFER THE VARIABLES WHEN NOT WRITTEN CLEARLY. THANK YOU!arrow_forwardA chemical engineer desiring to study the evaporation rate of water from brine evaporation beds obtained data on the number of inches of evaporation in each of 55 July days spread over 4 years. The data are given in the following stem and leaf plot, which shows that the smallest data value was 0.02 inch, and the largest 0.56 inch. Stem Leaf 0.0 2, 6 0.1 1, 4 0.2 1, 1, 1, 3, 3, 4, 5, 5, 5, 6, 9 0.3 0, 0, 2, 2, 2, 3, 3, 3, 3, 4, 4, 5, 5, 5, 6, 6, 7, 8, 9 0.4 0, 1, 2, 2, 2, 3, 4, 4, 4, 5, 5, 5, 7, 8, 8, 8, 9, 9 0.5 2, 5, 6 Find the: a) sample mean; b) sample median; c) sample standard deviation of these data. d) Do the data appear to be approximately normal? e) What percentage of data values are within 1 standard deviation of the mean?arrow_forward
- A mercury thermometer, which has been on a table for some time, is registering the room temperature, 50°F. Suddenly, it is placed in a 395°F oil bath. The following data are obtained for the response of the thermometer. If after 10 seconds the thermometer reading is 176 F, determine the thermometer time constant. Round off the final ans to whole number Please show your complete solution and write readable.arrow_forwardA manufacturer claims that the average tensile strength of thread A exceeds the average tensile strength of thread B by at least 12 kilograms. To test this claim, 50 pieces of each type of thread were tested under similar conditions. Type A thread had an average tensile strength of 86.7 kilograms with a standard deviation of 6.28 kilograms, while type B thread had an average tensile strength of 77.8 kilograms with a standard deviation of 5.61 kilograms. Test the manufacturer’s claim using a 0.05 level of significance. 1. Determine the Z calculated in two decimal places. 2. Determine the Z table in two decimal places. 3. Is the manufacturing claim statistically valid? yes or noarrow_forwardPlease make the exact scoot of this graph. Make sure everything is the same. Make sure it runs through MATLAB with no errors. Please make it exactly the same. I need help with this.arrow_forward
- After creating a decision matrix for two types of materials used to design a safety belt, an engineer assigns a weight of 4 to nylon for thickness and a weight of 5 to polyester for thickness. The engineer also assigns a weight of 4 to nylon for strength and a weight of 3 to polyester for strength. Polyester is more expensive than nylon. Describe which material would be preferable to use for the safety belt, if cost is prioritized as a criterionarrow_forwardThe viscosity of a light mineral oil is tested by the settlings sphere method given the following data calculate the viscosity drop equals 61.5 cm time of drop equals 2.1 second density of oil equals 0.838 g/mL density of sphere equals 1.89 g/cm^3. Radius of sphere equals 0.80 cm.arrow_forwardA fixed amount of ideal gas is kept in a container of fixed volume. The absolute pressure P, in pascals, of the gas is plotted as a function of its temperature T, in degrees Celsius. Which of the following are properties of a best fit curve to the data? Select two answers. a. Having a positive slope b. Passing through the origin c. Having zero pressure at a certain negative temperature d. Approaching zero pressure as temperature approaches infinityarrow_forward
- Five of your classmates measured the diagonal length of the blackboard. Classmate A measured it as 2.54 m; classmate B as 2.46 m; classmate C as 2.65 m; classmate D as 2.55 m; and classmate E as 2.39m. Find the variance and standard deviation of the measurements. Also, express the average measurement in a form that includes uncertainty.arrow_forwardThe following data provide the time in months from hire to promotion to manager for a random sample of 25 software engineers from all software engineers employed by a large telecommunications firm. 5 7 229 453 12 14 18 14 14 483 22 21 25 23 24 34 37 34 49 64 47 67 69 192 125 Calculate the mean, variance, and standard deviation for this sample.arrow_forwardA _____system uses measurements of disturbance variables to position the manipulated variable in such a way as to minimize any resulting deviation. The disturbance variables could be either measured loads or the set point, the former being more common.arrow_forward
 Elements Of ElectromagneticsMechanical EngineeringISBN:9780190698614Author:Sadiku, Matthew N. O.Publisher:Oxford University Press
 Mechanics of Materials (10th Edition)Mechanical EngineeringISBN:9780134319650Author:Russell C. HibbelerPublisher:PEARSON
 Thermodynamics: An Engineering ApproachMechanical EngineeringISBN:9781259822674Author:Yunus A. Cengel Dr., Michael A. BolesPublisher:McGraw-Hill Education
 Control Systems EngineeringMechanical EngineeringISBN:9781118170519Author:Norman S. NisePublisher:WILEY
 Mechanics of Materials (MindTap Course List)Mechanical EngineeringISBN:9781337093347Author:Barry J. Goodno, James M. GerePublisher:Cengage Learning
 Engineering Mechanics: StaticsMechanical EngineeringISBN:9781118807330Author:James L. Meriam, L. G. Kraige, J. N. BoltonPublisher:WILEY