
Videos
One of the NAE Grand Challenges for Engineering is Develop Carbon Sequestration Methods Accord1ng to the NAE website “In pre-industrial times, every million molecules of air contained about 280 molocules of carbon dioxide. Today that proportion exceeds 380 molecules per million, and 11 continues to climb. Evidence is mounting that carbon dioxide’s heat-trapping power has already started to boost average global temperatures. If carbon dioxide levels continue upward, further warming could have dire consequences, resulting from rising sea levels, agriculture disruptions and stronger storms (e.g, hurricanes) striking more often·”
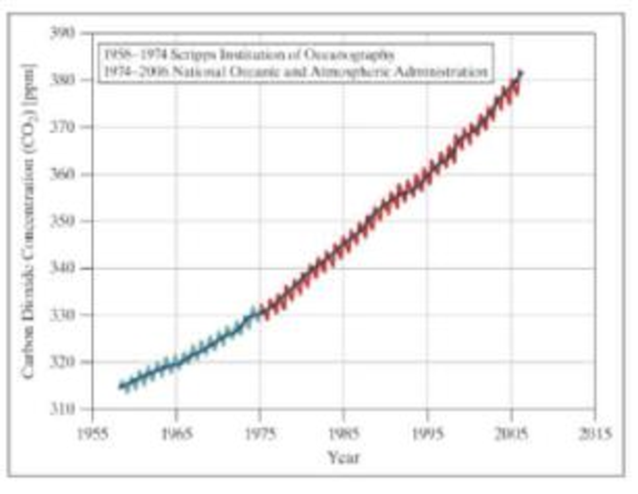
The Mauna Loa Carbon Dioxide Record is the longest continuous record of atmospheric concentrations of carbon dioxide (CO2), the chief greenhouse gas responsible for global climate warming. These data are modeled as the Keeling curve, a graph showing the variation in concentration of atmospheric CO2 based on measurements taken at the Mauna Loa Observatory in Hawali under the supervision of Charles David Keeling. It is often called the most important geophysical record on Earth and has been instrumental in showing that mankind is changing the composition of the atmosphere through the combustion of fossil fuels.
The Keeling curve also shows a cyclic variation in each year corresponding to the seasonal change in the uptake of CO2 by the world’s land vegetation. Most of this vegetation is in the northern hemisphere, where most of the land is located. The level decreases from northern spring onward as new plant growth takes CO2 out of the atmosphere through photosynthesis and rises again in the northern fall as plants and leaves die off and decay to release the gas back into the atmosphere.
Data and wording for this problem set were obtained from www.esrl.noaa.gov/gmd/ccgg/trends/. Additional information on the Mauna Loa Observatory can be found at http://scrippsco2.ucsd.edu/
Note
In the graph, A and Bare not drawn to scale, and the locations of C, D, and E are approximate In other words, you cannot guess the value based upon the graph—you must calculate the value.
Examine the estimated increase in monthly CO2 emissions for 2019, taken from the Mauna Loa data set. All values given are in parts per million [ppm] CO2 as the difference between the December 2018 and the monthly 2019 reading.

a. What is the mean of these data?
b. What is the median of these data?
c. The variance of the data set shown here is 5.37 parts per million squared [ppm2]. What is the standard deviation of these data?
d. The estimated annual growth rates for Mauna Loa are close, but not identical to the global growth rates. The standard deviation of the differences is 0.76 parts per millon per year [ppm/year]. What is the variance?
Want to see the full answer?
Check out a sample textbook solution
Chapter 14 Solutions
THINKING LIKE AN ENGINEER W/ACCESS


- 6. If we approximate the atmosphere to be 79% Nitrogen (N2) by volume and 21% oxygen (O2), estimate the density of air (kg/m3) and ppmv at 1 atmosphere and ambient temperatures of 40 C and 450 C. (Atomic weight of nitrogen=14)arrow_forwardDiscuss how you might measure the bulk modulus of a liquid.arrow_forwardIn the United States, electricity is sold using the SI units of kilowatt (kW) or megawatt (MW), and fuel for power generation stations is generally purchased using English units, e.g., British thermal unit (Btu), gallon (gal), and ton. An industrial power plant has an average annual load of 100 MW (electrical). If the overall thermal efficiency is 33% (based on HHV), what is the annual cost of fuel if the plant is fired with (a) natural gas, (b) No. 2 fuel oil, and (c) bituminous coal? Use the data from Tables 2.2, 2.7, and 2.13. Assume the cost of natural gas is $5/million Btu, the cost of No. 2 fuel oil is $3/gal, and the cost of bituminous coal is $60/ton (1 ton = 2000 lbm)arrow_forward
- When a hydrocarbon fuel is burned, almost all of the carbon in the fuel burns completely to form CO2 (carbon dioxide). On average, 0.59 kg of CO2 is produced for each kWh of electricity generated from a power plant that burns natural gas. A typical new household refrigerator uses about 700 kWh of electricity per year. There are 50,000 households in the city. If the area of the city is 190 miles2, and if all that CO2 accumulates in the atmosphere, calculate the increase in CO2 concentration by weight in the atmosphere knowing that each cm2 of area carries a column of air that weighs 1 kg. If 1 mature tree absorbs 48 lbm of CO2 per year, what is the ratio of trees to households this city should have to counter the effect of refrigeration?arrow_forwardSuppose you open a bottle of perfume at one end of a room. Very roughly, how much time would pass before a person at the other end of the room could smell the perfume, if diffusion were the only transport mechanism? Do you think diffusion is the dominant transport mechanism in this situation?arrow_forward1. If you place 10.0 L of methanol (CH4O) in a sealed room that is 4.75 m long, 2.5 m wide, and 2.5 m high, will all the methanol evaporate? If some liquid remains, how much will there be? The vapor pressure of methanol is 127 torr at 25 °C, and the density of the liquid at this temperature is 0.791 g/mL. Treat the room dimensions as exact numbers.arrow_forward
- A tentative rule was given about tipping in Testing Experiment Table 8.4, where if a vertical line passing through the object's center of mass is within the object's area of support the object does not tip. According to the rule, the full box of crackers in the following experiment, which has a width of 13 cm and a height of 20 cm, was seen to tip at an angle of: θc=tan−1(13 cm/20 cm)=33∘θ According to the rule, at what angle will a box with the left half filled with crackers begin to tip? Assume the box is light-weight and that the contents remain in the configuration inarrow_forwardThe digital thermometers that we use in the lab today are similar to the ones that we use in our homes, but several years ago scientists used to use glass thermometers that contained a thin column of mercury to measure temperature. Why do you think we no longer use the mercury thermometers in the lab?arrow_forwardAccording to the U.S. Geological survey, the volume of water in oceans, seas, and bays is 1.41 ✕ 1018 m3. The average concentration of naturally occurring uranium in seawater is 3.15 ✕ 10−6 kg/m3. If 0.670% of naturally occurring uranium is the fissionable isotope U-235 and each fission reaction yields 200 MeV, estimate the amount of time the uranium in the seawater on the planet could meet the planet's energy needs at an average usage of 1.94 ✕ 1013 J/s.arrow_forward
- For a gas, which of the following does not vary with temperature? - the gas soecific weight - the gas dynamic viscosity - the gas specific volume - the gas constant R - the gas densityarrow_forward750 ml of a gas is at 185 kPa gage pressure and 64 °C. Determine the number of molecules in the gas.arrow_forwardcan you help me solve this question about equlibrium of a particle using the polygon method? four pieces of string are tied to a massless ring. the forces acting on the ring are in gram-force.arrow_forward
 Elements Of ElectromagneticsMechanical EngineeringISBN:9780190698614Author:Sadiku, Matthew N. O.Publisher:Oxford University Press
 Mechanics of Materials (10th Edition)Mechanical EngineeringISBN:9780134319650Author:Russell C. HibbelerPublisher:PEARSON
 Thermodynamics: An Engineering ApproachMechanical EngineeringISBN:9781259822674Author:Yunus A. Cengel Dr., Michael A. BolesPublisher:McGraw-Hill Education
 Control Systems EngineeringMechanical EngineeringISBN:9781118170519Author:Norman S. NisePublisher:WILEY
 Mechanics of Materials (MindTap Course List)Mechanical EngineeringISBN:9781337093347Author:Barry J. Goodno, James M. GerePublisher:Cengage Learning
 Engineering Mechanics: StaticsMechanical EngineeringISBN:9781118807330Author:James L. Meriam, L. G. Kraige, J. N. BoltonPublisher:WILEY