Videos
Iona Company, a large printing company, is in its fourth year of a five-year, quality improvement program. The program began in 20x0 with an internal study that revealed the quality costs being incurred. In that year, a five-year plan was developed to lower quality costs to 10 percent of sales by the end of 20x5. Sales and quality costs for each year are as follows:
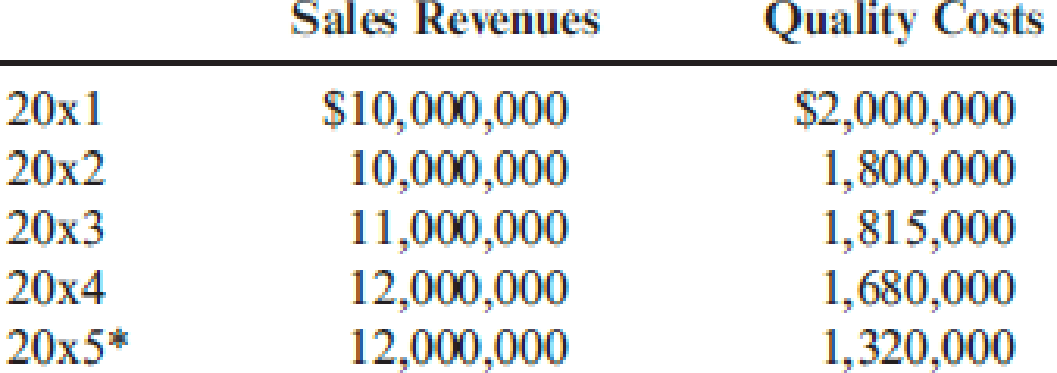
* Budgeted figures.
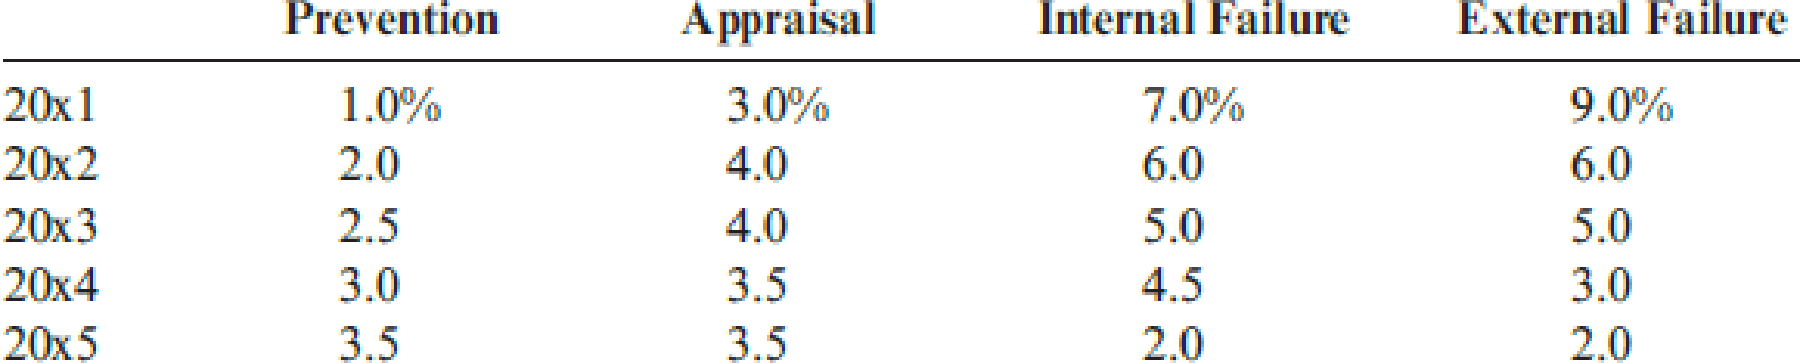
Quality costs by category are expressed as a percentage of sales as follows:
The detail of the 20x5 budget for quality costs is also provided.
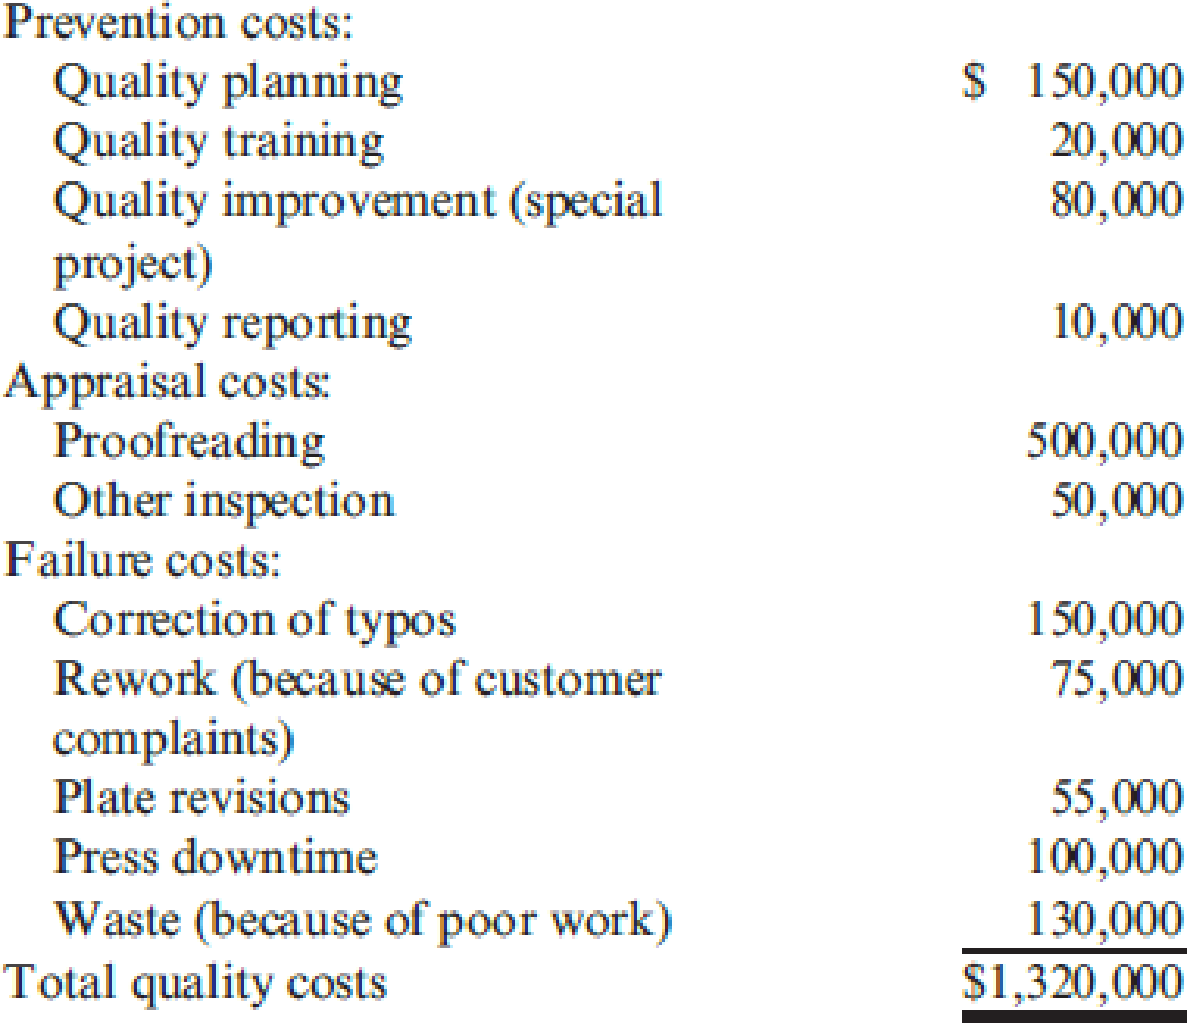
All prevention costs are fixed; all other quality costs are variable.
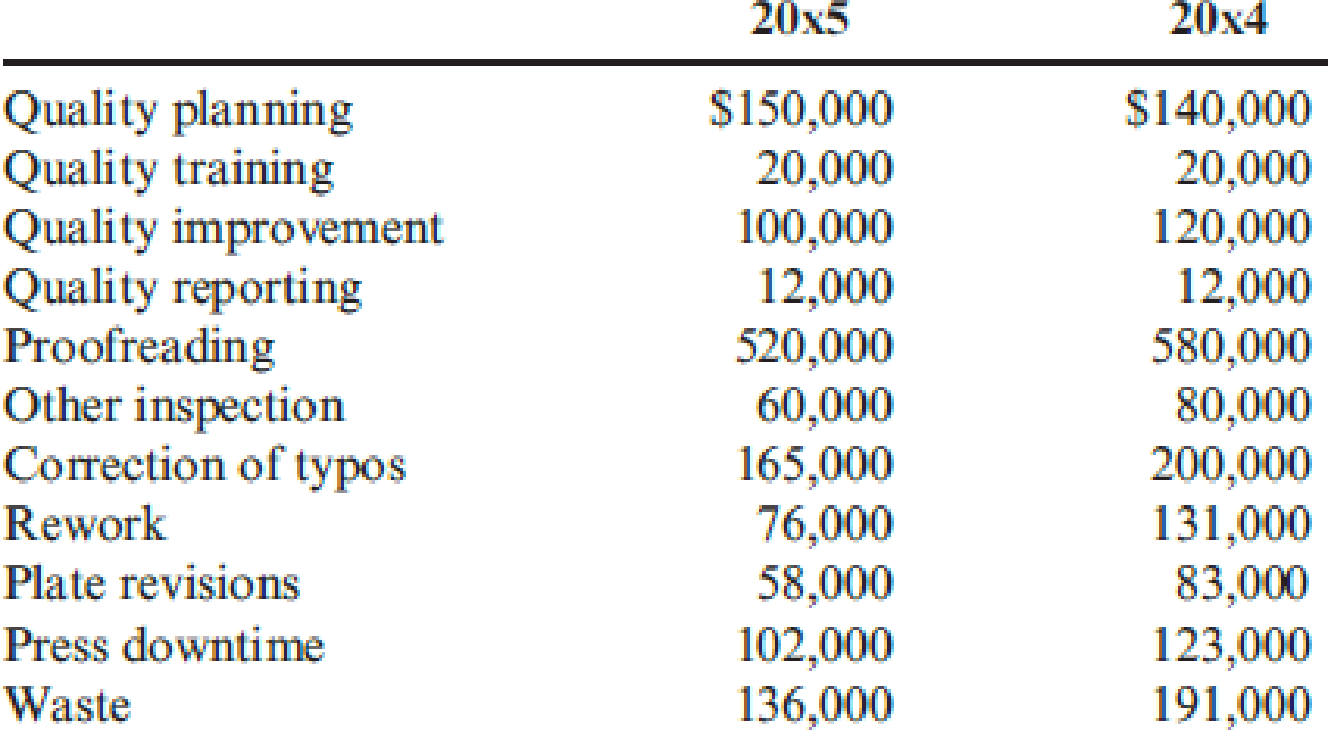
During 20x5, the company had $12 million in sales. Actual quality costs for 20x4 and 20x5 are as follows:
Required:
- 1. Prepare an interim quality cost performance report for 20x5 that compares actual quality costs with budgeted quality costs. Comment on the firm’s ability to achieve its quality goals for the year.
- 2. Prepare a one-period quality performance report for 20x5 that compares the actual quality costs of 20x4 with the actual costs of 20x5. How much did profits change because of improved quality?
- 3. Prepare a graph that shows the trend in total quality costs as a percentage of sales since the inception of the quality improvement program.
- 4. Prepare a graph that shows the trend for all four quality cost categories for 20x1 through 20x5. How does this graph help management know that the reduction in total quality costs is attributable to quality improvements?
- 5. Assume that the company is preparing a second five-year plan to reduce quality costs to 2.5 percent of sales. Prepare a long-range quality cost performance report assuming sales of $15 million at the end of five years. Assume that the final planned relative distribution of quality costs is as follows: proofreading, 50 percent; other inspection, 13 percent; quality training, 30 percent; and quality reporting, 7 percent.
1.
Prepare an interim quality cost performance report for the year 20x5 that compares actual quality costs with budgeted quality costs and comment on the ability of the firm for achieving its quality goals for the year.
Explanation of Solution
Quality cost performance reports: In a quality cost performance report, identification of quality standard is the main element and it has two important elements namely; actual outcomes and expected or standard outcomes.
Interim quality report: Interim quality performance report compares the actual quality at the end of the period with the budgeted costs and this report examines the progress attained within the period comparative to the planned level of progress for that period.
Prepare an interim quality cost performance report for the year 20x5:
| Company I | ||||
| Interim Performance Report: Quality Costs | ||||
| For the Year Ended December 31, 20x5 | ||||
| Particulars |
Actual Costs (a) |
Budgeted costs (b) |
Variance | |
| Prevention costs: | ||||
| Fixed: | ||||
| Quality planning | $150,000 | $150,000 | $0 | |
| Quality training | $20,000 | $20,000 | $0 | |
| Quality improvement | $100,000 | $80,000 | $20,000 | U |
| Quality reporting | $12,000 | $10,000 | $2,000 | U |
| Total prevention costs | $282,000 | 260,000 | $22,000 | U |
| Appraisal costs: | ||||
| Variable: | ||||
| Proofreading | $520,000 | $500,000 | $20,000 | U |
| Other inspection | $60,000 | $50,000 | $10,000 | U |
| Total appraisal costs | $580,000 | 550,000 | $30,000 | U |
| Failure costs: | ||||
| Variable: | ||||
| Correction of typos | $165,000 | $150,000 | $15,000 | U |
| Rework | $76,000 | $75,000 | $1,000 | U |
| Plate revisions | $58,000 | $55,000 | $3,000 | U |
| Press downtime | $102,000 | $100,000 | $2,000 | U |
| Waste | $ 136,000 | $130,000 | $ 6,000 | U |
| Total failure costs | $537,000 | $510,000 | $27,000 | U |
| Total quality costs | $1,399,000 | $1,320,000 | $79,000 | U |
Table (1)
Every single category and each individual item are equivalent to or higher than the budgeted amounts. Therefore, the firm cannot achieve its budgeted goals for the year.
2.
Prepare a one-period quality performance report for 20x5 that compares the actual quality costs of 20x4 with the actual costs of 20x5 and state the amount of change in profit due to improvement in quality.
Explanation of Solution
Prepare a one-period quality performance report for 20x5:
| Company I | ||||
| Performance Report: Quality Costs | ||||
| One-Year Trend | ||||
| For the Year Ended December 31, 20x5 | ||||
| Particulars |
Actual Costs 20x5 (a) |
Actual Costs 20x4 (b) |
Variance | |
| Prevention costs: | ||||
| Fixed: | ||||
| Quality planning | $150,000 | $140,000 | ($10,000) | U |
| Quality training | $20,000 | $20,000 | $0 | |
| Quality improvement | $100,000 | $120,000 | $20,000 | F |
| Quality reporting | $12,000 | $12,000 | $0 | |
| Total prevention costs | $282,000 | $292,000 | $10,000 | F |
| Appraisal costs: | ||||
| Variable: | ||||
| Proofreading | $520,000 | $580,000 | $60,000 | F |
| Other inspection | $60,000 | $80,000 | $20,000 | F |
| Total appraisal costs | $580,000 | $660,000 | $80,000 | F |
| Failure costs: | ||||
| Variable: | ||||
| Correction of typos | $165,000 | $200,000 | $35,000 | F |
| Rework | $76,000 | $131,000 | $55,000 | F |
| Plate revisions | $58,000 | $83,000 | $25,000 | F |
| Press downtime | $102,000 | $123,000 | $21,000 | F |
| Waste | $ 136,000 | $191,000 | $ 55,000 | F |
| Total failure costs | $537,000 | $728,000 | $191,000 | F |
| Total quality costs | $1,399,000 | $1,680,000 | $281,000 | F |
Table (2)
- The quality cost reduced from 20x4 to 20x5; therefore, the profit increased to $281,000. There is still considerable improvement even though the budgeted reductions for the year are not met.
- Additionally, the improvement was due to the “reduction of failure costs” which is a positive sign denoting that quality is certainly increasing.
3.
Prepare a graph that shows the trend in total quality costs as a percentage of sales since the inception of the quality improvement program.
Explanation of Solution
Multiple-period quality trend reports: Multiple-period quality trend reports is a chart or graph that tracks the change in quality from the starting of the program to the present.
Prepare a graph:
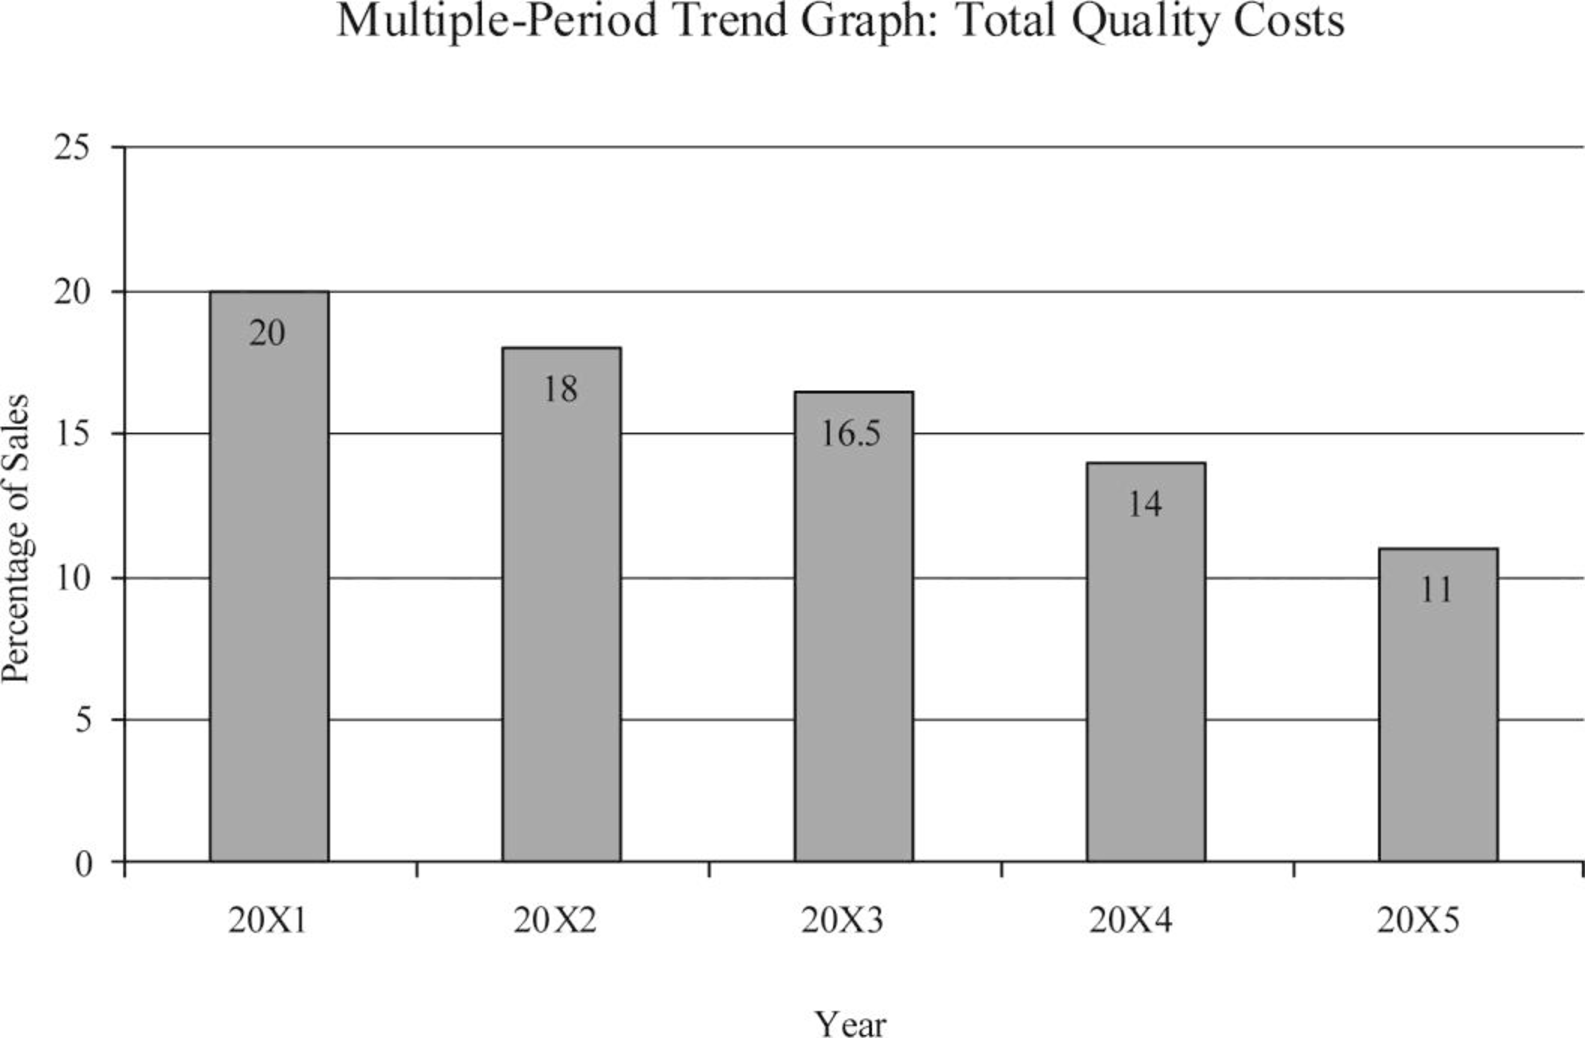
Figure (1)
Working notes:
(1)Calculate the percent of sales:
| Year |
Quality Costs (a) |
Sales Revenues (b) |
Percent of sales |
| 20x1 | $2,000,000 | $10,000,000 | 20% |
| 20x2 | $1,800,000 | $10,000,000 | 18% |
| 20x3 | $1,815,000 | $11,000,000 | 16.5% |
| 20x4 | $1,680,000 | $12,000,000 | 14% |
| 20x5 | $1,320,000 | $12,000,000 | 11.65% |
Table (3)
4.
Prepare a graph that shows the trend for all four quality cost categories for 20x1 through 20x5 and state the manner in which the graphs helps management to know that the reduction in total quality costs is attributable to quality improvement.
Explanation of Solution
Prepare a graph:
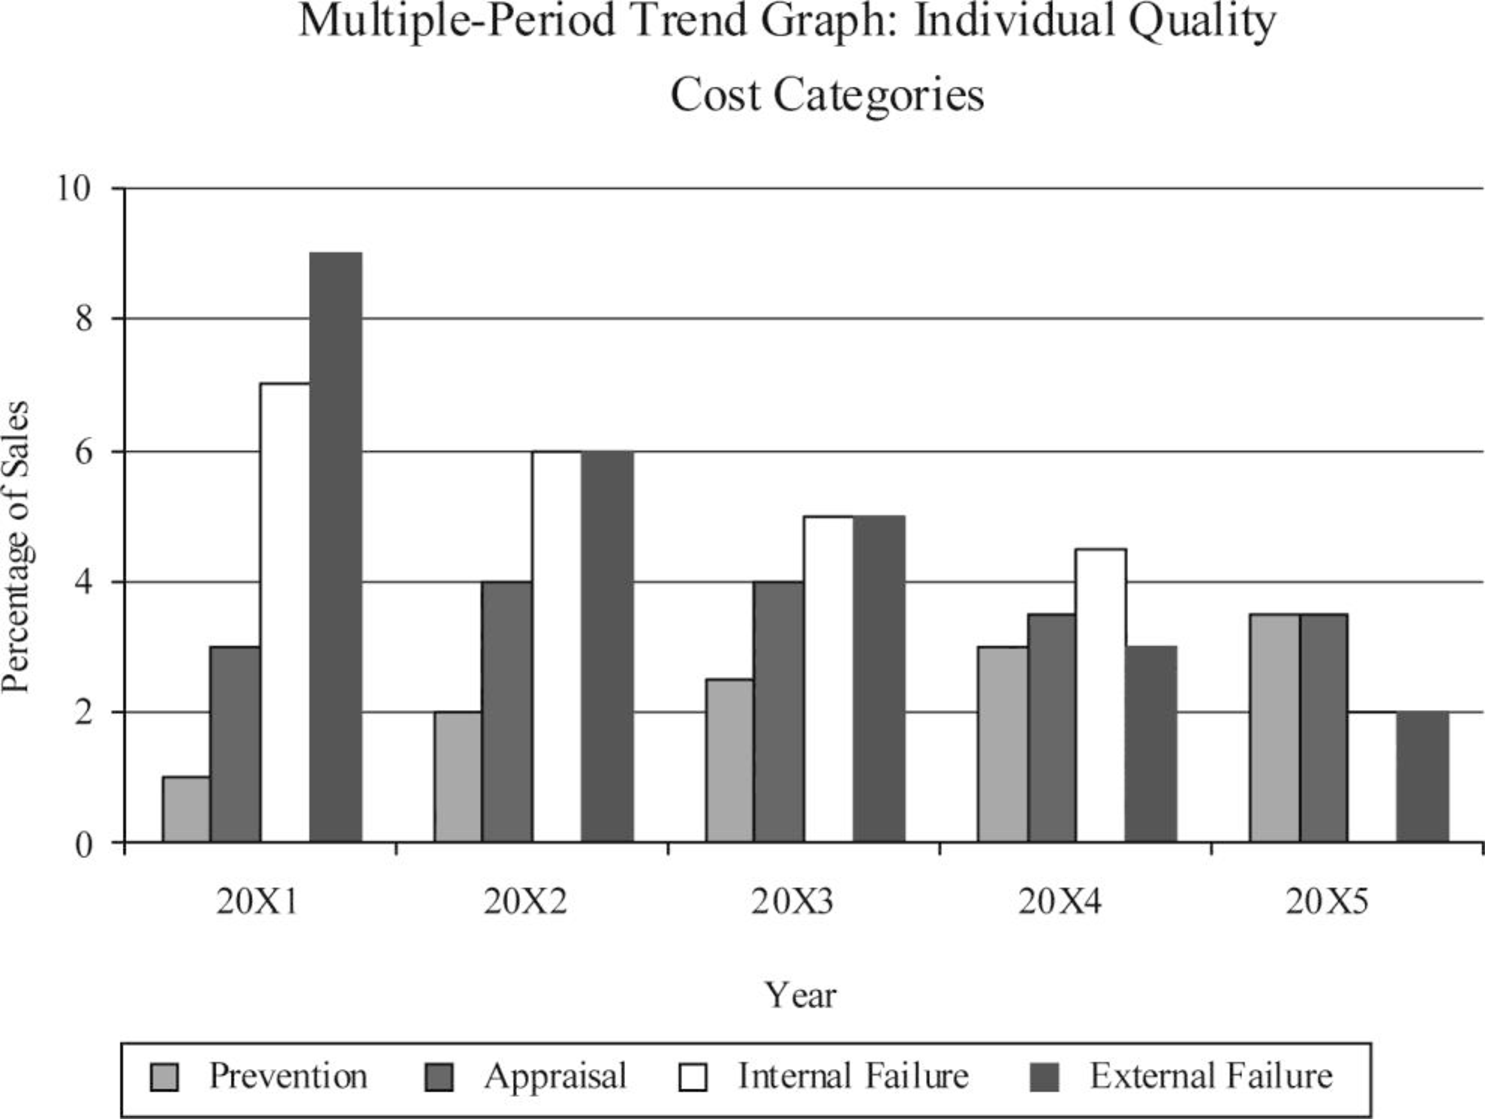


Figure (2)
“Increases in prevention and appraisal costs” along with simultaneous decrease in failure costs are good indication that in general quality is increasing. It is to be noted, that decreases in external failure costs are mostly difficult to attain without increase in actual quality.
5.
Prepare a long-range quality cost performance report.
Explanation of Solution
Long-range performance report: Long-range performance report compares the “current actual” with the costs that will be allowed if the “zero-defects standard” is being met by assuming that sales level is equal to that of the existing period.
Prepare a long-range quality cost performance report:
| Company I | ||||
| Performance Report: Quality Costs | ||||
| One-Year Trend | ||||
| For the Year Ended December 31, 20x5 | ||||
| Particulars |
Actual Costs 20x5 (a) |
Long-Range Target Costs (b) |
Variance | |
| Prevention costs: | ||||
| Fixed: | ||||
| Quality planning | $150,000 | $0 | $150,000 | U |
| Quality training | $20,000 | (9)$112,500 | ($92,500) | F |
| Quality improvement | $100,000 | $0 | $100,000 | U |
| Quality reporting | $12,000 | (10)$26,250 | ( $14,250) | F |
| Total prevention costs | $282,000 | $138,750 | $143,250 | U |
| Appraisal costs: | ||||
| Variable: | ||||
| Proofreading | (2)$650,000 | (11)$187,500 | $462,500 | U |
| Other inspection | (3) $75,000 | (12)$48,750 | $26,250 | U |
| Total appraisal costs | $725,000 | $236,250 | $488,750 | U |
| Failure costs: | ||||
| Variable: | ||||
| Correction of typos | (4)$206,250 | $0 | $206,250 | U |
| Rework | (5)$95,000 | $0 | $95,000 | U |
| Plate revisions | (6)$72,500 | $0 | $72,500 | U |
| Press downtime | (7)$127,500 | $0 | $127,500 | U |
| Waste | (8) $170,000 | $0 | $170,000 | U |
| Total failure costs | $671,250 | $0 | $671,250 | U |
| Total quality costs | $1,678,250 | $375,000 | $1,303,250 | U |
Table (4)
Note: Apart from for prevention costs, which is a fixed cost, actual costs of 20x5, are adjusted to a sales level of $15 million.
Workings notes:
(2)Calculate the proofreading costs:
(3)Calculate the other inspection costs:
(4)Calculate the correction of typos costs:
(5)Calculate the rework costs:
(6)Calculate the plate revision costs:
(7)Calculate the press downtime costs:
(8)Calculate the cost of waste:
(9)Calculate the long-range target costs for quality training:
(10)Calculate the long-range target costs for quality reporting:
(11)Calculate the long-range target costs for proofreading:
(12)Calculate the long-range target costs for other inspection:
(13)Calculate the amount of total quality costs:
Want to see more full solutions like this?
Chapter 14 Solutions
Bundle: Cornerstones of Cost Management, Loose-Leaf Version, 4th + CengageNOWv2, 1 term Printed Access Card


- Javier Company has sales of 8 million and quality costs of 1,600,000. The company is embarking on a major quality improvement program. During the next three years, Javier intends to attack failure costs by increasing its appraisal and prevention costs. The right prevention activities will be selected, and appraisal costs will be reduced according to the results achieved. For the coming year, management is considering six specific activities: quality training, process control, product inspection, supplier evaluation, prototype testing, and redesign of two major products. To encourage managers to focus on reducing non-value-added quality costs and select the right activities, a bonus pool is established relating to reduction of quality costs. The bonus pool is equal to 10 percent of the total reduction in quality costs. Current quality costs and the costs of these six activities are given in the following table. Each activity is added sequentially so that its effect on the cost categories can be assessed. For example, after quality training is added, the control costs increase to 320,000, and the failure costs drop to 1,040,000. Even though the activities are presented sequentially, they are totally independent of each other. Thus, only beneficial activities need be selected. Required: 1. Identify the control activities that should be implemented, and calculate the total quality costs associated with this selection. Assume that an activity is selected only if it increases the bonus pool. 2. Given the activities selected in Requirement 1, calculate the following: a. The reduction in total quality costs b. The percentage distribution for control and failure costs c. The amount for this years bonus pool 3. Suppose that a quality engineer complained about the gainsharing incentive system. Basically, he argued that the bonus should be based only on reductions of failure and appraisal costs. In this way, investment in prevention activities would be encouraged, and eventually, failure and appraisal costs would be eliminated. After eliminating the non-value-added costs, focus could then be placed on the level of prevention costs. If this approach were adopted, what activities would be selected? Do you agree or disagree with this approach? Explain.arrow_forwardEvans Company had total sales of 3,000,000 for fiscal 20x5. The costs of quality-related activities are given below. Required: 1. Prepare a quality cost report, classifying costs by category and expressing each category as a percentage of sales. What message does the cost report provide? 2. Prepare a bar graph and pie chart that illustrate each categorys contribution to total quality costs. Comment on the significance of the distribution. 3. What if, five years from now, quality costs are 7.5 percent of sales, with control costs being 65 percent of the total quality costs? What would your conclusion be?arrow_forwardShalimar Company manufactures and sells industrial products. For next year, Shalimar has budgeted the follow sales: In Shalimars experience, 10 percent of sales are paid in cash. Of the sales on account, 65 percent are collected in the quarter of sale, 25 percent are collected in the quarter following the sale, and 7 percent are collected in the second quarter after the sale. The remaining 3 percent are never collected. Total sales for the third quarter of the current year are 4,900,000 and for the fourth quarter of the current year are 6,850,000. Required: 1. Calculate cash sales and credit sales expected in the last two quarters of the current year, and in each quarter of next year. 2. Construct a cash receipts budget for Shalimar Company for each quarter of the next year, showing the cash sales and the cash collections from credit sales. 3. What if the recession led Shalimars top management to assume that in the next year 10 percent of credit sales would never be collected? The expected payment percentages in the quarter of sale and the quarter after sale are assumed to be the same. How would that affect cash received in each quarter? Construct a revised cash budget using the new assumption.arrow_forward
- In 20x4, Tru-Delite Frozen Desserts, Inc., instituted a quality improvement program. At the end of 20x5, the management of the corporation requested a report to show the amount saved by the measures taken during the year. The actual sales and quality costs for 20x4 and 20x5 are as follows: Tru-Delites management believes that quality costs can be reduced to 2.5 percent of sales within the next five years. At the end of 20x9, Tru-Delites sales are projected to grow to 750,000. The projected relative distribution of quality costs at the end of 20x9 is as follows: Required: 1. Profits increased by what amount due to quality improvements made in 20x5? 2. Prepare a long-range performance report that compares the quality costs incurred at the end of 20x5 with the quality cost structure expected at the end of 20x9. 3. Are the targeted costs in the year 20x9 all value-added costs? How would you interpret the variances if the targeted costs are value-added costs? 4. What would be the profit increase in 20x9 if the 2.5 percent performance standard is met in that year?arrow_forwardShalimar Company manufactures and sells industrial products. For next year, Shalimar has budgeted the following sales: Quarter 1 $4,620,000 Quarter 2 5,150,000 Quarter 3 4,890,000 Quarter 4 8,480,000 In Shalimar’s experience, 10 percent of sales are paid in cash. Of the sales on account, 65 percent are collected in the quarter of sale, 25 percent are collected in the quarter following the sale, and 7 percent are collected in the second quarter after the sale. The remaining 3 percent are never collected. Total sales for the third quarter of the current year are $5,040,000 and for the fourth quarter of the current year are $7,680,000. Required: Question Content Area 1. Calculate cash sales and credit sales expected in the last two quarters of the current year, and in each quarter of next year. Quarter Cash Sales Credit Sales 3, current year $fill in the blank 1d3d12fb3fb1016_1 $fill in the blank 1d3d12fb3fb1016_2 4, current year fill in the blank…arrow_forwardAn engineer has a fluctuating future budget for the maintenance of a particular machine. During each of the first 5 years, $10, 000 per year will be budgeted. During the second 5 years, the annual budget will be $15, 000 per year. In addition, $5000 will be budgeted for an overhaul of the machine at the end of the fourth year, and again at the end of the eighth year. What uniform annual expenditure would be equivalent, if interest is 8% per year?arrow_forward
- Shalimar Company manufactures and sells industrial products. For next year, Shalimar has budgeted the following sales: Quarter 1 $4,780,000 Quarter 2 5,580,000 Quarter 3 3,150,000 Quarter 4 8,400,000 In Shalimar’s experience, 10 percent of sales are paid in cash. Of the sales on account, 65 percent are collected in the quarter of sale, 25 percent are collected in the quarter following the sale, and 7 percent are collected in the second quarter after the sale. The remaining 3 percent are never collected. Total sales for the third quarter of the current year are $5,450,000 and for the fourth quarter of the current year are $7,060,000. Required: 1. Calculate cash sales and credit sales expected in the last two quarters of the current year, and in each quarter of next year. Quarter Cash Sales Credit Sales 3, current year $fill in the blank $fill in the blank 4, current year fill in the blank fill in the blank 1, next year fill in the blank fill in the blank…arrow_forwardShalimar Company manufactures and sells industrial products. For next year, Shalimar has budgeted the following sales: Quarter 1 $4,740,000 Quarter 2 5,860,000 Quarter 3 3,720,000 Quarter 4 8,580,000 In Shalimar’s experience, 10 percent of sales are paid in cash. Of the sales on account, 65 percent are collected in the quarter of sale, 25 percent are collected in the quarter following the sale, and 7 percent are collected in the second quarter after the sale. The remaining 3 percent are never collected. Total sales for the third quarter of the current year are $5,410,000 and for the fourth quarter of the current year are $7,070,000. Required: Question Content Area 1. Calculate cash sales and credit sales expected in the last two quarters of the current year, and in each quarter of next year. Quarter Cash Sales Credit Sales 3, current year $fill in the blank 9d2fe401a04bf88_1 $fill in the blank 9d2fe401a04bf88_2 4, current year fill in the blank…arrow_forwardThe next two questions are based on the following information: Herald company, a jacket selling company, prepares its master budget for the year 2020 on a quarterly basis. The budget officer has gathered the following data: 1 Estimated Sales for each quarter is $230,000. All sales are on credit and all sales are collected in the following quarter. 2 Cost of goods sold for each quarter is $100,000. 3 Variable selling and adminstrative expenses for each jacket are 10% sales commission. 4 Fixed selling and adminstrative (S&A) expenses for the year are: Advertising 60,000 120,000 40,000 20,000 240,000 Executive salaries Insurance Depreciation Total fixed S&A expenses 5 The company expects to borrow $80,000 on April, 1, 2020. No principal will be repaid during the year; Interest rate at an annual rate of 10% is due quarterly. 6 The company will declare $3,000 dividend in December 2020, which will be paid in January 2021. 10 How much is the net income for the year 2020? А. $179,000 $182,000…arrow_forward
- 2. Shalimar Company manufactures and sells industrial products. For next year, Shalimar has budgeted the following sales: Quarter 1 $4,780,000 Quarter 2 5,690,000 Quarter 3 630,000 Quarter 4 8,200,000 In Shalimar’s experience, 10 percent of sales are paid in cash. Of the sales on account, 65 percent are collected in the quarter of sale, 25 percent are collected in the quarter following the sale, and 7 percent are collected in the second quarter after the sale. The remaining 3 percent are never collected. Total sales for the third quarter of the current year are $5,080,000 and for the fourth quarter of the current year are $7,220,000. Required: Question Content Area 1. Calculate cash sales and credit sales expected in the last two quarters of the current year, and in each quarter of next year. Quarter Cash Sales Credit Sales 3, current year $fill in the blank b0590a054f99004_1 $fill in the blank b0590a054f99004_2 4, current year fill in the blank…arrow_forwardPrepare a complete projected income statement in the contribution format for each scenario, in the manner of a flexible budget. Please show work Carolina Manufacturing Company has been operating at a loss for several years. A management team has assembled to determine what course of action to take next year to reach profitability. They begin by reviewing the most recent income statement (below). Carolina Manufacturing Company Income Statement For the Year Ended December 31 Sales (45,000 units at $15) Less cost of goods sold: Net loss Direct materials Direct labor Manufacturing overhea Gross margin Less operating expenses Selling expenses Variable Sales commissions Shipping 135,000 117,450 147,750 Fixed (advertising, salaries) Administrative expenses Variable (billing and other) Fixed (salaries and other) 40,500 8,100 180,000 $675,000 400,200 274,800 228,600 2,700 72,000 74,700 ($28,500)arrow_forwardRegal Furnitures produces and sells high-quality reading tables. One of the very popular models in the reading table lineup is RT360. The management accountant of the company is in the process of preparing its Selling and Administrative Expense Budget for the first quarter of the year. The following budget data are available: Assume that all of these expenses (except depreciation) are paid in cash in the month they are incurred. Answer the following questions:a) If Regal Furnitures has budgeted to sell 19,000 RT360 tables in January, then what will be the total budgeted selling and administrative expenses for January?b) If the company has budgeted to sell 16,000 RT360 tables in February, then what will be the budgeted total cash disbursements for selling and administrative expenses for February?c) If the budgeted total cash disbursements for selling and administrative expenses for March total Tk. 459,200, then how many RT360 table does the company plan to sell in March?arrow_forward
 Cornerstones of Cost Management (Cornerstones Ser...AccountingISBN:9781305970663Author:Don R. Hansen, Maryanne M. MowenPublisher:Cengage Learning