Bundle: Cornerstones of Cost Management, Loose-Leaf Version, 4th + CengageNOWv2, 1 term Printed Access Card
4th Edition
ISBN: 9781337539098
Author: Hansen
Publisher: CENGAGE L
expand_more
expand_more
format_list_bulleted
Videos
Textbook Question
Chapter 14, Problem 38P
In 2011, Milton Thayne, president of Carbondale Electronics, received a report indicating that quality costs were 31 percent of sales. Faced with increasing pressures from imported goods, Milton resolved to take measures to improve the overall quality of the company’s products. After hiring a consultant in 20x0, the company began an aggressive program of total quality control. At the end of 20x5, Milton requested an analysis of the progress the company had made in reducing and controlling quality costs. The Accounting Department assembled the following data:
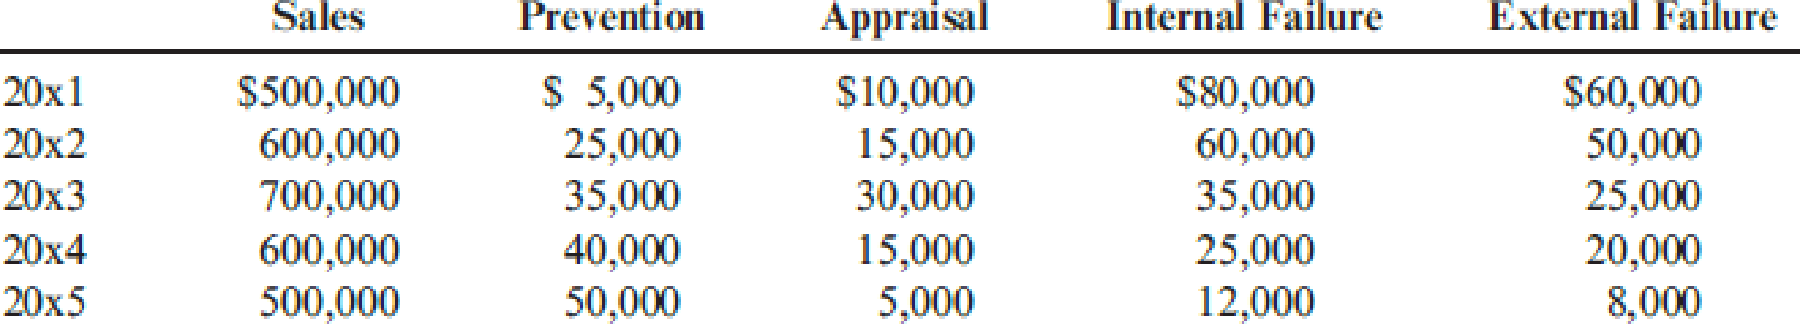
Required:
- 1. Compute the quality costs as a percentage of sales by category and in total for each year.
- 2. Prepare a multiple-year trend graph for quality costs, both by total costs and by category. Using the graph, assess the progress made in reducing and controlling quality costs. Does the graph provide evidence that quality has improved? Explain.
- 3. Using the 20x1 quality cost relationships (assume all costs are variable), calculate the quality costs that would have prevailed in 20x4. By how much did profits increase in 20x4 because of the quality improvement program? Repeat for 20x5.
Expert Solution & Answer

Trending nowThis is a popular solution!

Students have asked these similar questions
ABC Corporation has recently completed a project to reduce total production costs by 5%. Net
income has risen as a result, but the stock price has suffered from recent public disclosures about
faulty products. The vice president for manufacturing and the controller are concerned that their
successful cost-cutting efforts have resulted in lower market valuation. They are beginning to
understand that product quality has a cost component and they have asked you, a CMA, to explain
the concept of “cost of quality'" to them.
A. Define, categorize, and give examples of the "cost of quality."
B. What is value chain analysis and how could this impact the company's evaluation of costs?
C. What other business process improvement tools may benefit the company?
Lindell Manufacturing embarked on an ambitious quality program that is centered on continual improvement. This improvement is operationalized by declining quality costs from year toyear. Lindell rewards plant managers, production supervisors, and workers with bonuses ranging from $1,000 to $10,000 if their factory meets its annual quality cost goals.Len Smith, manager of Lindell’s Boise plant, felt obligated to do everything he could toprovide this increase to his employees. Accordingly, he has decided to take the following actionsduring the last quarter of the year to meet the plant’s budgeted quality cost targets:a. Decrease inspections of the process and final product by 50% and transfer inspectorstemporarily to quality training programs. Len believes this move will increase theinspectors’ awareness of the importance of quality; also, decreasing inspection willproduce significantly less downtime and less rework. By increasing the output anddecreasing the costs of internal failure,…
Mercury, Incorporated, produces cell phones at its plant in Texas. A year ago, a consumer survey ranked the company's cell phones
low in product quality. Shocked by this result, Jorge Gomez, Mercury's president, set up a task force to implement a formal quality
improvement program. Included on this task force were representatives from the Engineering, Marketing, Customer Service,
Production, and Accounting departments. After working together for a year, the task force prepared the quality cost report shown
below:
Prevention costs:
Machine maintenance
Training suppliers
Quality circles
Total prevention cost
Appraisal costs:
Incoming inspection
Final testing
Total appraisal cost
Internal failure costs:
Rework
Scrap
Total internal failure cost
External failure costs:
Warranty repairs
Customer returns
Mercury, Incorporated
Quality Cost Report
(in thousands)
Total external failure cost
Total quality cost
Total production cost
Prevention costs:
Machine maintenance
Training suppliers
Quality…
Chapter 14 Solutions
Bundle: Cornerstones of Cost Management, Loose-Leaf Version, 4th + CengageNOWv2, 1 term Printed Access Card
Ch. 14 - What is the difference between quality of design...Ch. 14 - Why are quality costs the costs of doing things...Ch. 14 - Prob. 3DQCh. 14 - Describe the Taguchi quality loss function, and...Ch. 14 - Identify and discuss the four kinds of quality...Ch. 14 - Explain why external failure costs can be more...Ch. 14 - Prob. 7DQCh. 14 - Prob. 8DQCh. 14 - Describe the three types of quality performance...Ch. 14 - Prob. 10DQ
Ch. 14 - If a firms annual sales are 200 million, what...Ch. 14 - Explain why it is important for a manager to...Ch. 14 - Prob. 13DQCh. 14 - Explain why the Accounting Department should be...Ch. 14 - Prob. 15DQCh. 14 - What is ecoefficiency?Ch. 14 - Prob. 17DQCh. 14 - Prob. 18DQCh. 14 - Prob. 19DQCh. 14 - What are the four categories of environmental...Ch. 14 - Prob. 21DQCh. 14 - What does full environmental costing mean? Full...Ch. 14 - What information is communicated by the unit...Ch. 14 - Evans Company had total sales of 3,000,000 for...Ch. 14 - Prob. 2CECh. 14 - Ross Company implemented a quality improvement...Ch. 14 - Nabors Company had actual quality costs for the...Ch. 14 - Verde Company reported operating costs of...Ch. 14 - Pinter Company had the following environmental...Ch. 14 - Rachel Boyce, president of a company that...Ch. 14 - Quality attributes such as performance and...Ch. 14 - Stahman, Inc., estimates its hidden external...Ch. 14 - Prob. 10ECh. 14 - Abernathy, Inc., produces two different generators...Ch. 14 - Kang Company reported sales of 3,240,000 in 20x5....Ch. 14 - Gagnon Company reported the following sales and...Ch. 14 - Muskogee Company had sales of 60,000,000 in 20x1....Ch. 14 - Javier Company has sales of 8 million and quality...Ch. 14 - In 20x4, Tru-Delite Frozen Desserts, Inc.,...Ch. 14 - Prob. 17ECh. 14 - Prob. 18ECh. 14 - Achieving sustainable development will likely...Ch. 14 - Classify the following environmental activities as...Ch. 14 - At the end of 20x5, Bing Pharmaceuticals began to...Ch. 14 - Prob. 22ECh. 14 - Coyle Pharmaceuticals produces two organic...Ch. 14 - Prob. 24ECh. 14 - Which of the following quality costs is an...Ch. 14 - Which of the following would be a hidden quality...Ch. 14 - Using the Taguchi quality loss function, an...Ch. 14 - Environmental costs are those costs incurred...Ch. 14 - Two products, Product A and Product B, are...Ch. 14 - Kathy Shorts, president of Oliver Company, was...Ch. 14 - Panguitch Company manufactures a component for...Ch. 14 - Gaston Company manufactures furniture. One of its...Ch. 14 - Classify the following quality costs as...Ch. 14 - Wayne Johnson, president of Banshee Company,...Ch. 14 - Recently, Ulrich Company received a report from an...Ch. 14 - In 20x5, Major Company initiated a full-scale,...Ch. 14 - Paper Products Division produces paper diapers,...Ch. 14 - In 2011, Milton Thayne, president of Carbondale...Ch. 14 - Iona Company, a large printing company, is in its...Ch. 14 - Prob. 40PCh. 14 - The following items are listed in an environmental...Ch. 14 - Refer to Problem 14.41. In the environmental...Ch. 14 - The following environmental cost reports for 20x3,...Ch. 14 - Refer to Problem 14.43. In 20x3, Jack Carter,...
Knowledge Booster


Learn more about
Need a deep-dive on the concept behind this application? Look no further. Learn more about this topic, accounting and related others by exploring similar questions and additional content below.Similar questions
- In 20X1, Don Blackburn, president of Price Electronics, received a report indicating that quality costs were 31% of sales. Faced with increasing pressures from imported goods. Don resolved to take measures to improve the overall quality of the companys products. After hiring a consultant in 20X1, the company began an aggressive program of total quality control. At the end of 20X5, Don requested an analysis of the progress the company had made in reducing and controlling quality costs. The accounting department assembled the following data: Required: 1. Compute the quality costs as a percentage of sales by category and in total for each year. 2. Prepare a multiple-year trend graph for quality costs, both by total costs and by category. Using the graph, assess the progress made in reducing and controlling quality costs. Does the graph provide evidence that quality has improved? Explain. 3. Using the 20X1 quality cost relationships (assume all costs are variable), calculate the quality costs that would have prevailed in 20X4. By how much did profits increase in 20X4 because of the quality improvement program? Repeat for 20X5.arrow_forwardRecently, Ulrich Company received a report from an external consulting group on its quality costs. The consultants reported that the companys quality costs total about 21 percent of its sales revenues. Somewhat shocked by the magnitude of the costs, Rob Rustin, president of Ulrich Company, decided to launch a major quality improvement program. For the coming year, management decided to reduce quality costs to 17 percent of sales revenues. Although the amount of reduction was ambitious, most company officials believed that the goal could be realized. To improve the monitoring of the quality improvement program, Rob directed Pamela Golding, the controller, to prepare monthly performance reports comparing budgeted and actual quality costs. Budgeted costs and sales for the first two months of the year are as follows: The following actual sales and actual quality costs were reported for January: Required: 1. Reorganize the monthly budgets so that quality costs are grouped in one of four categories: appraisal, prevention, internal failure, or external failure. (Essentially, prepare a budgeted cost of quality report.) Also, identify each cost as variable (V) or fixed (F). (Assume that no costs are mixed.) 2. Prepare a performance report for January that compares actual costs with budgeted costs. Comment on the companys progress in improving quality and reducing its quality costs.arrow_forwardIn 20x5, Major Company initiated a full-scale, quality improvement program. At the end of the year, Jack Aldredge, the president, noted with some satisfaction that the defects per unit of product had dropped significantly compared to the prior year. He was also pleased that relationships with suppliers had improved and defective materials had declined. The new quality training program was also well accepted by employees. Of most interest to the president, however, was the impact of the quality improvements on profitability. To help assess the dollar impact of the quality improvements, the actual sales and the actual quality costs for 20x4 and 20x5 are as follows by quality category: All prevention costs are fixed (by discretion). Assume all other quality costs are unit-level variable. Required: 1. Compute the relative distribution of quality costs for each year and prepare a pie chart. Do you believe that the company is moving in the right direction in terms of the balance among the quality cost categories? Explain. 2. Prepare a one-year trend performance report for 20x5 (compare the actual costs of 20x5 with those of 20x4, adjusted for differences in sales volume). How much have profits increased because of the quality improvements made by Major Company? 3. Estimate the additional improvement in profits if Major Company ultimately reduces its quality costs to 2.5 percent of sales revenues (assume sales of 10 million).arrow_forward
- Kathy Shorts, president of Oliver Company, was concerned with the trend in sales and profitability. The company had been losing customers at an alarming rate. Furthermore, the company was barely breaking even. Investigation revealed that poor quality was at the root of the problem. At the end of 20x5, Kathy decided to begin a quality improvement program. As a first step, she identified the following costs in the accounting records as quality related: Required: 1. Prepare a quality cost report by quality cost category. 2. Calculate the relative distribution percentages for each quality cost category. Comment on the distribution. 3. Using the Taguchi loss function, an average loss per unit is computed to be 15 per unit. What are the hidden costs of external failure? How does this affect the relative distribution? 4. Shortss quality manager decided not to bother with the hidden costs. What do you think was his reasoning? Any efforts to reduce measured external failure costs will also reduce the hidden costs. Do you agree or disagree? Explain.arrow_forwardAt the beginning of the last quarter of 20x1, Youngston, Inc., a consumer products firm, hired Maria Carrillo to take over one of its divisions. The division manufactured small home appliances and was struggling to survive in a very competitive market. Maria immediately requested a projected income statement for 20x1. In response, the controller provided the following statement: After some investigation, Maria soon realized that the products being produced had a serious problem with quality. She once again requested a special study by the controllers office to supply a report on the level of quality costs. By the middle of November, Maria received the following report from the controller: Maria was surprised at the level of quality costs. They represented 30 percent of sales, which was certainly excessive. She knew that the division had to produce high-quality products to survive. The number of defective units produced needed to be reduced dramatically. Thus, Maria decided to pursue a quality-driven turnaround strategy. Revenue growth and cost reduction could both be achieved if quality could be improved. By growing revenues and decreasing costs, profitability could be increased. After meeting with the managers of production, marketing, purchasing, and human resources, Maria made the following decisions, effective immediately (end of November 20x1): a. More will be invested in employee training. Workers will be trained to detect quality problems and empowered to make improvements. Workers will be allowed a bonus of 10 percent of any cost savings produced by their suggested improvements. b. Two design engineers will be hired immediately, with expectations of hiring one or two more within a year. These engineers will be in charge of redesigning processes and products with the objective of improving quality. They will also be given the responsibility of working with selected suppliers to help improve the quality of their products and processes. Design engineers were considered a strategic necessity. c. Implement a new process: evaluation and selection of suppliers. This new process has the objective of selecting a group of suppliers that are willing and capable of providing nondefective components. d. Effective immediately, the division will begin inspecting purchased components. According to production, many of the quality problems are caused by defective components purchased from outside suppliers. Incoming inspection is viewed as a transitional activity. Once the division has developed a group of suppliers capable of delivering nondefective components, this activity will be eliminated. e. Within three years, the goal is to produce products with a defect rate less than 0.10 percent. By reducing the defect rate to this level, marketing is confident that market share will increase by at least 50 percent (as a consequence of increased customer satisfaction). Products with better quality will help establish an improved product image and reputation, allowing the division to capture new customers and increase market share. f. Accounting will be given the charge to install a quality information reporting system. Daily reports on operational quality data (e.g., percentage of defective units), weekly updates of trend graphs (posted throughout the division), and quarterly cost reports are the types of information required. g. To help direct the improvements in quality activities, kaizen costing is to be implemented. For example, for the year 20x1, a kaizen standard of 6 percent of the selling price per unit was set for rework costs, a 25 percent reduction from the current actual cost. To ensure that the quality improvements were directed and translated into concrete financial outcomes, Maria also began to implement a Balanced Scorecard for the division. By the end of 20x2, progress was being made. Sales had increased to 26,000,000, and the kaizen improvements were meeting or beating expectations. For example, rework costs had dropped to 1,500,000. At the end of 20x3, two years after the turnaround quality strategy was implemented, Maria received the following quality cost report: Maria also received an income statement for 20x3: Maria was pleased with the outcomes. Revenues had grown, and costs had been reduced by at least as much as she had projected for the two-year period. Growth next year should be even greater as she was beginning to observe a favorable effect from the higher-quality products. Also, further quality cost reductions should materialize as incoming inspections were showing much higher-quality purchased components. Required: 1. Identify the strategic objectives, classified by the Balanced Scorecard perspective. Next, suggest measures for each objective. 2. Using the results from Requirement 1, describe Marias strategy using a series of if-then statements. Next, prepare a strategy map. 3. Explain how you would evaluate the success of the quality-driven turnaround strategy. What additional information would you like to have for this evaluation? 4. Explain why Maria felt that the Balanced Scorecard would increase the likelihood that the turnaround strategy would actually produce good financial outcomes. 5. Advise Maria on how to encourage her employees to align their actions and behavior with the turnaround strategy.arrow_forwardGagnon Company reported the following sales and quality costs for the past four years. Assume that all quality costs are variable and that all changes in the quality cost ratios are due to a quality improvement program. Required: 1. Compute the quality costs for all four years. By how much did net income increase from Year 1 to Year 2 because of quality improvements? From Year 2 to Year 3? From Year 3 to Year 4? 2. The management of Gagnon Company believes it is possible to reduce quality costs to 2.5 percent of sales. Assuming sales will continue at the Year 4 level, calculate the additional profit potential facing Gagnon. Is the expectation of improving quality and reducing costs to 2.5 percent of sales realistic? Explain. 3. Assume that Gagnon produces one type of product, which is sold on a bid basis. In Years 1 and 2, the average bid was 400. In Year 1, total variable costs were 250 per unit. In Year 3, competition forced the bid to drop to 380. Compute the total contribution margin in Year 3 assuming the same quality costs as in Year 1. Now, compute the total contribution margin in Year 3 using the actual quality costs for Year 3. What is the increase in profitability resulting from the quality improvements made from Year 1 to Year 3?arrow_forward
- Danna Lummus, the president of Karlene Company, has recently returned from a conference on quality and productivity. At the conference, she learned that many American firms have made significant progress in improving quality and reducing quality costs. Many of these firms have been able to reduce quality costs from 20 to 30 percent of sales to 2 to 3 percent of sales. She was skeptical, however, about this statistic. Even if the quality gurus were right, she was sure that her company’s quality costs were much lower—probably less than 5 percent. On the other hand, if she was wrong, she would be passing up an opportunity to improve profits significantly and simultaneously strengthen her competitive position. In fact, she reflected on the com- ment of one of the quality experts: “Quality has become a condition of entrance to the market. If the product is not good, you will quickly go out of business.” The qual- ity issue was at least worth exploring. Moreover, she decided that it may be…arrow_forwardAt the end of 2021, Mejorar Company implemented a low-cost strategy to improve its competitive position. Its objective was to become the low-cost producer in its industry. A Balanced Scorecard was developed to guide the company toward this objective. To lower costs, Mejorar undertook a number of improvement activities such as JIT production, total quality management, and activity-based management. Now, after two years of operation, the president of Mejorar wants some assessment of the achievements. To help provide this assessment, the following information on one product has been gathered: 1. Compute the following measures for 2021 and 2023: a. actual velocity and cycle time (2021 and 2023) (My question: In the book it stated that Actual Velocity (# units produced/time) and Cycle Time (time/# units produced) However, which one is per hour and per minute Or maybe I wrong let me know?) b. Percentage of total revenue from new customers (2021 and 2023) (assume one unit per customer) c.…arrow_forwardIn response to intensive foreign competition, the management of Florex Company has attempted over the past year to improve the quality of its products. A statistical process control system has been installed and other steps have been taken to decrease the amount of warranty and other field costs, which have been trending upward over the past several years. Costs relating to quality and quality control over the last two years are given below: Costs (in thousands) Last This Year Year $ 1,584 Inspection Quality engineering Depreciation of test eguipment 765 540 675 630 225 $ 1,260 $ 1,620 225 Rework labor Statistical process control Cost of field servicing $ 1,710 1,170 81 Supplies used in testing Systems development Warranty repairs Net cost of scrap Product testing Product recalls 45 630 900 1,260 24 4,140 1,530 $ 1,440 990 540 900 $ 2,700 900 Disposal of defective products 900 Sales have been flat over the past few years, at $90,000,000 per year. A great deal of money has been spent in…arrow_forward
- Dana Wise, president of Tidwell Company, recently returned from a conference on quality and productivity. At the conference, he was told that many firms have quality costs totaling 20 to 30% of sales. The quality experts at the conference convinced him that a company could increase its profitability by improving quality. However, he was of the opinion that the quality of Tidwell Company was much less than 20% - probably more in the 4 to 6% range. However, because the potential for increasing profits was so great if he was wrong, he decided to request a preliminry estimate of the total quality costs currently being incurred. He asked his controller for a summary of quality costs, with the costs classified into four categories: prevention, appraisal, internal failure, or external failure. He also wanted the costs expressed as a percentage of both sales and profits. The controller had his staff assemble the following information from the past year, 20x1: a. Sales revenue,…arrow_forwardSKE Corporation manufactures large kitchen appliances. The following represents financial information for two years: Mr. Cheung is also reviewing the quality of various production process. Recently several competitors have introduced similar prototype chips with much higher quality and causing SKE's sales to decline. Mr. Cheung has embarked an intensive campaign to strengthen its quality control at the beginning of 2023. The costs relating to quality control were complied for 2021 and the full year of 2022. The related costs are shown below 2021 2022 Process Inspection 60,000 52,800 Scrap 60,200 57,600 Quality Training 440,000 610,000 Warranty repairs 150,000 140,000 Testing equipment 230,000 230,000 Resolving customer complaints 108,400 89,000 Rework 390,000 544,000 Preventive maintenance 304,000 440,000 Material Inspection 150,000 210,000 Field Testing 400,000 300,000 Total costs $2,292,600 $2,673,400 Required: a. Prepare a cost of quality (COQ) report for 2021 and 2022, calculate…arrow_forwardIn response to intense foreign competition, Florex Company has taken steps to improve the quality of its products. A summary of its quality costs (in thousands) over the past two years is given below: Inspection Quality engineering Depreciation of test equipment Rework labor Statistical process control Cost of field servicing Supplies used in testing Systems development Warranty repairs Prevention costs: Total prevention costs Appraisal costs Total appraisal costs Internal failure costs: Costs (in thousands) Last Year Total internal failure costs External failure costs: $630 $ $ $ 420 $588 1,050 $0 1,260 $ 42 $840 $ 4,200 $420 $840 $ 2,520 $630 Net cost of scrap Product testing Product recalls Disposal of production defects. Sales have been flat over the past few years, at $84,000,000 per year. Total external failure costs Total quality cost This Year $ 1,008 Required: 1. Prepare a quality cost report for this year and last year. Note: Enter amount values in thousands. Round your…arrow_forward
arrow_back_ios
SEE MORE QUESTIONS
arrow_forward_ios
Recommended textbooks for you
 Cornerstones of Cost Management (Cornerstones Ser...AccountingISBN:9781305970663Author:Don R. Hansen, Maryanne M. MowenPublisher:Cengage Learning
 Managerial Accounting: The Cornerstone of Busines...AccountingISBN:9781337115773Author:Maryanne M. Mowen, Don R. Hansen, Dan L. HeitgerPublisher:Cengage Learning
Cornerstones of Cost Management (Cornerstones Ser...
Accounting
ISBN:9781305970663
Author:Don R. Hansen, Maryanne M. Mowen
Publisher:Cengage Learning
Managerial Accounting: The Cornerstone of Busines...
Accounting
ISBN:9781337115773
Author:Maryanne M. Mowen, Don R. Hansen, Dan L. Heitger
Publisher:Cengage Learning
Inspection and Quality control in Manufacturing. What is quality inspection?; Author: Educationleaves;https://www.youtube.com/watch?v=Ey4MqC7Kp7g;License: Standard youtube license