
Cornerstones of Cost Management
4th Edition
ISBN: 9780357155905
Author: Don R. Hansen; Maryanne M. Mowen
Publisher: Cengage Limited
expand_more
expand_more
format_list_bulleted
Videos
Textbook Question
Chapter 14, Problem 3CE
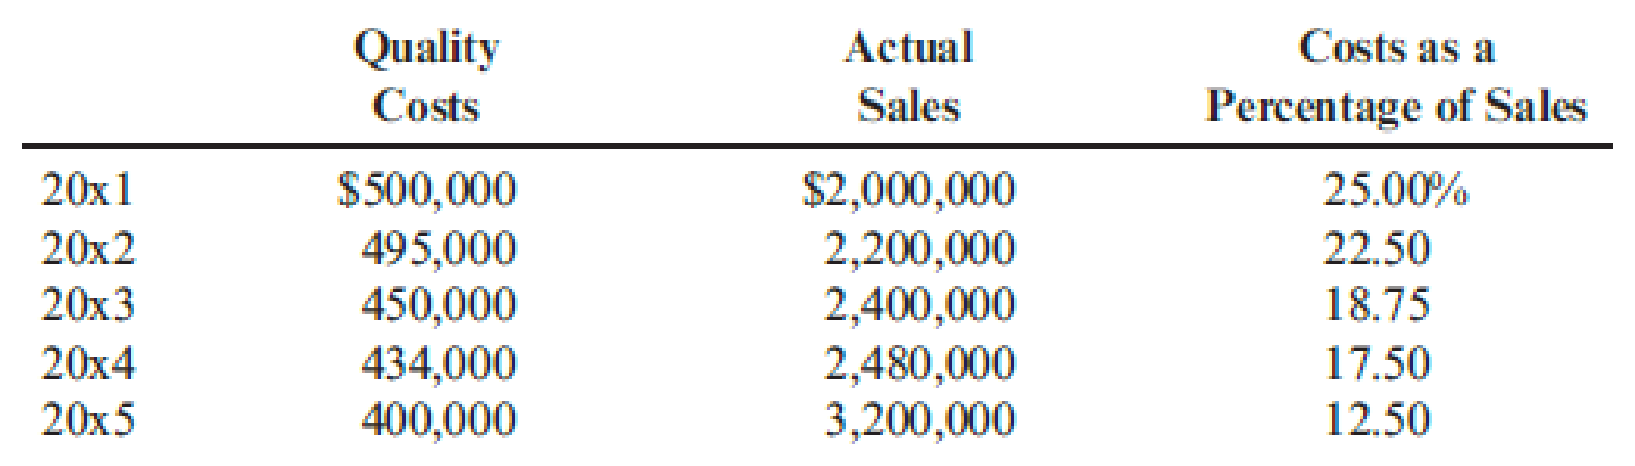
Ross Company implemented a quality improvement program and tracked the following for the five years:
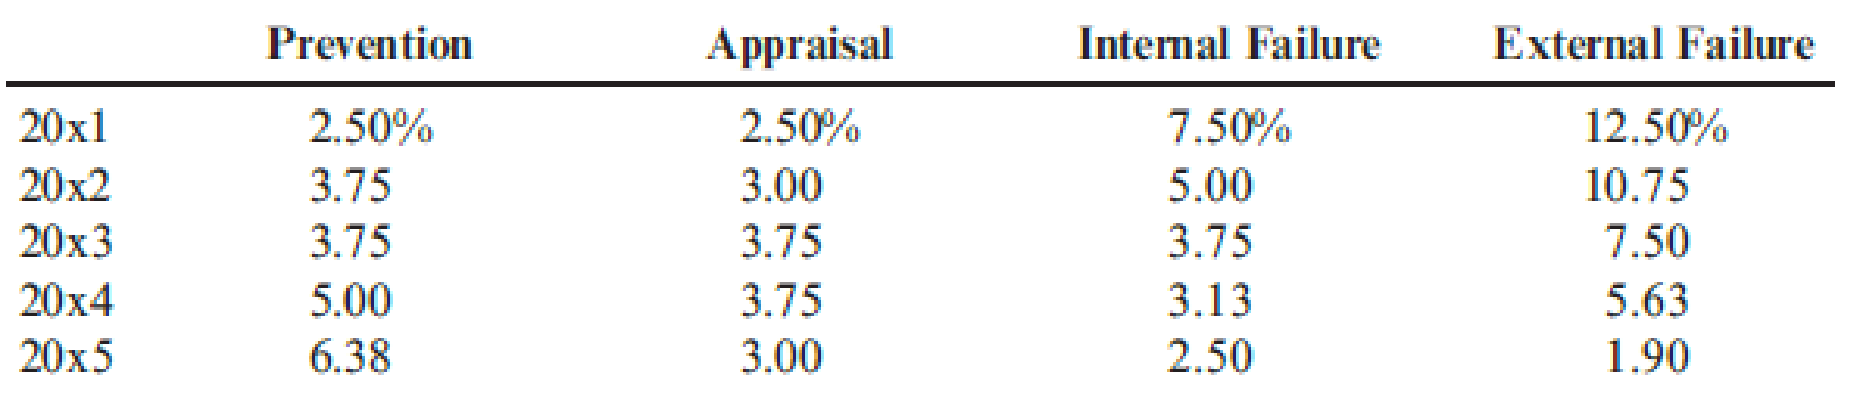
By cost category as a percentage of sales for the same period of time:
Required:
- 1. Prepare a bar graph that reveals the trend in quality cost as a percentage of sales (time on the horizontal axis and percentages on the vertical). Comment on the message of the graph.
- 2. Prepare a bar graph for each cost category as a percentage of sales. What does this graph tell you?
- 3. What if management would like to have the trend in relative distribution of quality costs? Express this as a bar graph and comment on its significance.
Expert Solution & Answer
Want to see the full answer?
Check out a sample textbook solution
Students have asked these similar questions
Prepare a cost of quality report. Round the percents of total quality cost to the nearest whole number and the percents of total
sales to one decimal place.
Cost of Quality Report
Percent of Total Quality
Quality Cost Classification
Quality Cost
Percent of Total Sales
Cost
Prevention
Appraisal
Internal failure
External failure
Total
%
1.1.0.0.0
%
%
%
%
%
1. How would a product life-cycle income statement differ from the above income statements?
2. Prepare a three-year life-cycle income statement for both products. Which product appears to be more profitable and why?
3. Prepare a schedule showing each cost category as a percentage of total annual costs. What do you think this indicates about the profitability of each product over the three-year life cycle?
Required:1. Compute the ROI and the margin and turnover ratios for each year for the FurnitureDivision. (Round your answers to four significant digits.)2. Compute the ROI and the margin and turnover ratios for each year for the HousewareDivision. (Round your answers to four significant digits.)3. Explain the change in ROI from Year 1 to Year 2 for each division.
Chapter 14 Solutions
Cornerstones of Cost Management
Ch. 14 - What is the difference between quality of design...Ch. 14 - Why are quality costs the costs of doing things...Ch. 14 - Prob. 3DQCh. 14 - Describe the Taguchi quality loss function, and...Ch. 14 - Identify and discuss the four kinds of quality...Ch. 14 - Explain why external failure costs can be more...Ch. 14 - Prob. 7DQCh. 14 - Prob. 8DQCh. 14 - Describe the three types of quality performance...Ch. 14 - Prob. 10DQ
Ch. 14 - If a firms annual sales are 200 million, what...Ch. 14 - Explain why it is important for a manager to...Ch. 14 - Prob. 13DQCh. 14 - Explain why the Accounting Department should be...Ch. 14 - Prob. 15DQCh. 14 - What is ecoefficiency?Ch. 14 - Prob. 17DQCh. 14 - Prob. 18DQCh. 14 - Prob. 19DQCh. 14 - What are the four categories of environmental...Ch. 14 - Prob. 21DQCh. 14 - What does full environmental costing mean? Full...Ch. 14 - What information is communicated by the unit...Ch. 14 - Evans Company had total sales of 3,000,000 for...Ch. 14 - Prob. 2CECh. 14 - Ross Company implemented a quality improvement...Ch. 14 - Nabors Company had actual quality costs for the...Ch. 14 - Verde Company reported operating costs of...Ch. 14 - Pinter Company had the following environmental...Ch. 14 - Rachel Boyce, president of a company that...Ch. 14 - Quality attributes such as performance and...Ch. 14 - Stahman, Inc., estimates its hidden external...Ch. 14 - Prob. 10ECh. 14 - Abernathy, Inc., produces two different generators...Ch. 14 - Kang Company reported sales of 3,240,000 in 20x5....Ch. 14 - Gagnon Company reported the following sales and...Ch. 14 - Muskogee Company had sales of 60,000,000 in 20x1....Ch. 14 - Javier Company has sales of 8 million and quality...Ch. 14 - In 20x4, Tru-Delite Frozen Desserts, Inc.,...Ch. 14 - Prob. 17ECh. 14 - Prob. 18ECh. 14 - Achieving sustainable development will likely...Ch. 14 - Classify the following environmental activities as...Ch. 14 - At the end of 20x5, Bing Pharmaceuticals began to...Ch. 14 - Prob. 22ECh. 14 - Coyle Pharmaceuticals produces two organic...Ch. 14 - Prob. 24ECh. 14 - Which of the following quality costs is an...Ch. 14 - Which of the following would be a hidden quality...Ch. 14 - Using the Taguchi quality loss function, an...Ch. 14 - Environmental costs are those costs incurred...Ch. 14 - Two products, Product A and Product B, are...Ch. 14 - Kathy Shorts, president of Oliver Company, was...Ch. 14 - Panguitch Company manufactures a component for...Ch. 14 - Gaston Company manufactures furniture. One of its...Ch. 14 - Classify the following quality costs as...Ch. 14 - Wayne Johnson, president of Banshee Company,...Ch. 14 - Recently, Ulrich Company received a report from an...Ch. 14 - In 20x5, Major Company initiated a full-scale,...Ch. 14 - Paper Products Division produces paper diapers,...Ch. 14 - In 2011, Milton Thayne, president of Carbondale...Ch. 14 - Iona Company, a large printing company, is in its...Ch. 14 - Prob. 40PCh. 14 - The following items are listed in an environmental...Ch. 14 - Refer to Problem 14.41. In the environmental...Ch. 14 - The following environmental cost reports for 20x3,...Ch. 14 - Refer to Problem 14.43. In 20x3, Jack Carter,...
Knowledge Booster


Learn more about
Need a deep-dive on the concept behind this application? Look no further. Learn more about this topic, accounting and related others by exploring similar questions and additional content below.Similar questions
- Norris Company implemented a quality improvement program and tracked the following for the 5 years: By cost category of sales for the same period of time: Required: 1. Prepare a bar graph (hat reveals the trend in quality cost as a percentage of sales (time on horizontal axis and percentages on the vertical). Comment on the message of the graph. 2. Prepare a bar graph for each cost category as a percentage of sales. What does this graph tell you?arrow_forwardThe controller of Emery, Inc. has computed quality costs as a percentage of sales for the past 5 years (20X1 was the first year the company implemented a quality improvement program). This information is as follows: Required: 1. Prepare a trend graph for total quality costs. Comment on what the graph has to say about the success of the quality improvement program. 2. Prepare a graph that shows the trend for each quality cost category. What does the graph have to say about the success of the quality improvement program? Does this graph supply more insight than the total cost trend graph does? 3. Prepare a graph that compares the trend in relative control costs versus relative failure costs. Comment on the significance of this trend.arrow_forwardGagnon Company reported the following sales and quality costs for the past four years. Assume that all quality costs are variable and that all changes in the quality cost ratios are due to a quality improvement program. Required: 1. Compute the quality costs for all four years. By how much did net income increase from Year 1 to Year 2 because of quality improvements? From Year 2 to Year 3? From Year 3 to Year 4? 2. The management of Gagnon Company believes it is possible to reduce quality costs to 2.5 percent of sales. Assuming sales will continue at the Year 4 level, calculate the additional profit potential facing Gagnon. Is the expectation of improving quality and reducing costs to 2.5 percent of sales realistic? Explain. 3. Assume that Gagnon produces one type of product, which is sold on a bid basis. In Years 1 and 2, the average bid was 400. In Year 1, total variable costs were 250 per unit. In Year 3, competition forced the bid to drop to 380. Compute the total contribution margin in Year 3 assuming the same quality costs as in Year 1. Now, compute the total contribution margin in Year 3 using the actual quality costs for Year 3. What is the increase in profitability resulting from the quality improvements made from Year 1 to Year 3?arrow_forward
- The following time series shows the sales of a particular product over the past 12 months. Construct a time series plot. What type of pattern exists in the data? Use α = 0.3 to compute the exponential smoothing values for the time series. Use trial and error to find a value of the exponential smoothing coefficient α that results in a relatively small MSE.arrow_forwardCost of Quality and Value-Added/Non-Value-Added Reports for a Service Company Three Rivers Inc. provides cable TV and Internet service to the local community. The activities and activity costs of Three Rivers are identified as follows: a. Identify the cost of quality classification for each activity and whether the activity is value-added or non-value-added. Value-Added/ Activity Quality Cost Non-Value-Added Quality Control Activities Cost Classification Classification Billing error correction $46,200 Cable signal testing 115,500 Reinstalling service (installed incorrectly the first 99,300 time) Repairing satellite equipment 46,200 Repairing underground cable connections to the 30,000 customer Replacing old technology cable with higher quality 158,500 cable Replacing old technology signal switches with 181,100 higher quality switches Responding to customer home repair requests 55,500 Training employees 37,700 Total activity cost $770,000arrow_forwardThe following list gives a number of measures associated with the Balanced Scorecard:a. Number of new customersb. Percentage of customer complaints resolved with one contactc. Unit product costd. Cost per distribution channele. Suggestions per employeef. Warranty repair costsg. Consumer satisfaction (from surveys)h. Cycle time for solving a customer problemi. Strategic job coverage ratioj. On-time delivery percentagek. Percentage of revenues from new productsRequired:1. Classify each performance measure as belonging to one of the following perspectives:financial, customer, internal business process, or learning and growth.2. Suggest an additional measure for each of the four perspectives.arrow_forward
- Cost of Quality and Value-Added/Non-Value-Added Reports for a Service Company Three Rivers Inc. provides cable TV and Internet service to the local community. The activities and activity costs of Three Rivers are identified as follows: a. Identify the cost of quality classification for each activity and whether the activity is value-added or non-value-added. Value-Added/ Non-Value-Added Classification Quality Control Activities Billing error correction Cable signal testing Reinstalling service (installed incorrectly the first time) Repairing satellite equipment Repairing underground cable connections to the customer Replacing old technology cable with higher quality cable Replacing old technology signal switches with higher quality switches Responding to customer home repair requests Training employees Total activity cost Activity Cost $35,400 108,800 76,000 34,000 23,000 151,400 173,000 42,400 36,000 $680,000 Quality Cost Classification Maxarrow_forwardBelow is a list of various metrics used to measure performance. For each metric, identify the correct balanced scorecard perspective with which the metric is associated. Metric Balanced Scorecard Perspective Average stock price Economic value added Employee turnover rates Manufacturing cycle time Market share Number of days from product launch to shelf Number of defects Number of new patent applications Percentage of repeat customers Percentage decrease in operating costs Percentage of sales generated by new products Research and development spending as a percentage of net revenues options: Customer Financial Internal Business Learning and Growtharrow_forwardAssume you have asked your data folks to determine the relationship between customer service scores (i.e. the ratings provided by customers in response to a survey) and profit. The analyst reports the following: "I gathered data for the last 48 months and ran a regression where profit in a given month is the dependent variable and customer service score in that same month is the independent variable. I found an intercept of $10,000 (p-value: 0.31) and the coefficient on customer service score is $1,200 (p-value: 0.22). The R-2 (which is appropriate when there is just one independent variable) is 0.07." What do you infer from the results (two to three sentences, sticking to the information provided) and why?arrow_forward
- Matching graphs with descriptions of cost and revenue behavior. (D. Green, adapted) Given here are a number of graphs. The horizontal axis of each graph represents the units produced over the year, and the vertical axis represents total cost or revenues. Indicate by number which graph best fits the situation or item described (a–h). Some graphs may be used more than once; some may not apply to any of the situations. Direct material costs Supervisors’ salaries for one shift and two shifts A cost-volume-profit graph Mixed costs—for example, car rental fixed charge plus a rate per mile driven Depreciation of plant, computed on a straight-line basis Data supporting the use of a variable-cost rate, such as manufacturing labor cost of $14 per unit produced Incentive bonus plan that pays managers $0.10 for every unit produced above some level of production Interest expense on $2 million borrowed at a fixed rate of interestarrow_forwardAdams Corporation evaluates divisional managers based on Return on Investment (ROI) and has provided the operating results of the Northern DIVislon from last year. The Controller has asked you to compute the ROI and Residual Income based on data from last year and If the alvislon adds a new product line. Use the Information Included in the Excel Simulation and the Excel functions described below to complete the task. • Cell Reference: Allows you to refer to data from another cell in the worksheet. From the Excel Simulation below, if in a blank cell, "=G5" was entered, the formula would output the result from cell G5, or 4.00 In this example. • Basic Math functions: Allows you to use the basic math symbols to perform mathematical functions. You can use the following keys: - (plus sign to add), - (minus sign to subtract). * (asterisk sign to multiply), and (forward slash to divide). From the Excel Simulation below, If in a blank cell "=G5-G6" was entered, the formula would add the values…arrow_forwardFernando Garza's firm wishes to use factor rating to help select an outsourcing provider of logistics services. a) With weights from 1 - 5 (5 being the highest) and ratings from 1 100 (100 being the highest), use the following table to help Garza make his decision. In the following table, compute the weighted average score for each of the three companies (enter your responses rounded to one decimal place). Weight Overnight Criterion Quality Delivery Cost (W) Shipping Worldwide Delivery United Freight 5 88 80 72 3 71 90 72 2 71 85 97 Weighted average score: 79.5 84 77 The best outsource provider is Worldwide Delivery b) Garza decides to increase the weights for quality, delivery, and cost to 10, 6, and 4, respectively. If each weight is doubled, the best outsource provider is Worldwide Delivery . How does this change your conclusions? A. The conclusion changes since the weighted averages change. B. The conclusion does not change but the weighted averages change. C. The conclusion…arrow_forward
arrow_back_ios
SEE MORE QUESTIONS
arrow_forward_ios
Recommended textbooks for you
 Cornerstones of Cost Management (Cornerstones Ser...AccountingISBN:9781305970663Author:Don R. Hansen, Maryanne M. MowenPublisher:Cengage Learning
 Managerial Accounting: The Cornerstone of Busines...AccountingISBN:9781337115773Author:Maryanne M. Mowen, Don R. Hansen, Dan L. HeitgerPublisher:Cengage Learning
 Excel Applications for Accounting PrinciplesAccountingISBN:9781111581565Author:Gaylord N. SmithPublisher:Cengage Learning
 Essentials of Business Analytics (MindTap Course ...StatisticsISBN:9781305627734Author:Jeffrey D. Camm, James J. Cochran, Michael J. Fry, Jeffrey W. Ohlmann, David R. AndersonPublisher:Cengage Learning
 Managerial AccountingAccountingISBN:9781337912020Author:Carl Warren, Ph.d. Cma William B. TaylerPublisher:South-Western College Pub
Cornerstones of Cost Management (Cornerstones Ser...
Accounting
ISBN:9781305970663
Author:Don R. Hansen, Maryanne M. Mowen
Publisher:Cengage Learning
Managerial Accounting: The Cornerstone of Busines...
Accounting
ISBN:9781337115773
Author:Maryanne M. Mowen, Don R. Hansen, Dan L. Heitger
Publisher:Cengage Learning
Excel Applications for Accounting Principles
Accounting
ISBN:9781111581565
Author:Gaylord N. Smith
Publisher:Cengage Learning
Essentials of Business Analytics (MindTap Course ...
Statistics
ISBN:9781305627734
Author:Jeffrey D. Camm, James J. Cochran, Michael J. Fry, Jeffrey W. Ohlmann, David R. Anderson
Publisher:Cengage Learning
Managerial Accounting
Accounting
ISBN:9781337912020
Author:Carl Warren, Ph.d. Cma William B. Tayler
Publisher:South-Western College Pub
Inspection and Quality control in Manufacturing. What is quality inspection?; Author: Educationleaves;https://www.youtube.com/watch?v=Ey4MqC7Kp7g;License: Standard youtube license