Elementary Statistics Plus MyLab Statistics with Pearson eText -- Title-Specific Access Card Package (13th Edition)
13th Edition
ISBN: 9780134763705
Author: Mario F. Triola
Publisher: PEARSON
expand_more
expand_more
format_list_bulleted
Concept explainers
Videos
Textbook Question
Chapter 14, Problem 4RE
Energy Consumption. Exercises 1–5 refer to the amounts of energy consumed in the author's home. (Most of the data are real, but some are fabricated.) Each value represents energy consumed (kWh) in a two-month period. Let each subgroup consist of the six amounts within the same year. Data are available for download at www.TriolaStats.com.
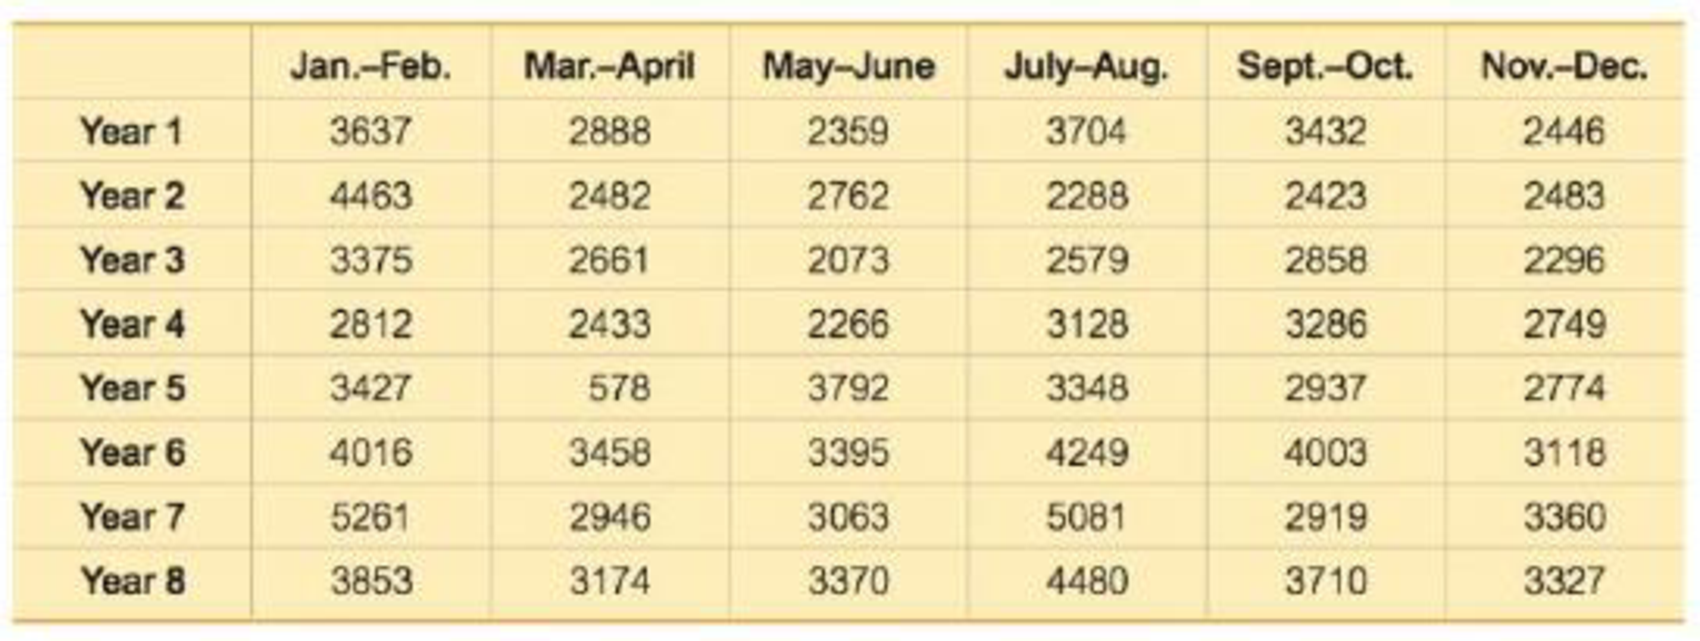
4. Energy Consumption: Run Chart Construct a run chart for the 48 values. Does there appear to be a pattern suggesting that the process is not within statistical control?
Expert Solution & Answer
Want to see the full answer?
Check out a sample textbook solution
Students have asked these similar questions
The price (in rands) in June of a 1 kg packet of laundry in KwaDukuza is shownis shown below for each 5 years.Year 2016 2017 2018 2019 2020Price 17.8 29.6 41.1 46.3 46.52.2.1 Find the percentage increase in the price of laundry detergent between eachperiod. (2)2.2.2 Use the 4 percentages in question 2.2.1 above, to calculate the overall geometricmean percentage increase in the price of laundry detergent each year. (3)2.2.3 Interpret the geometric mean calculated in 2.2.2 above.
Which of the following time periods will have the largest annual average increase in the percentage of jobs that could be fully automated (based on the provided images attached)?
A) 2020-2028
B) 2028-2030
C) 2030-2035
D) 2035-2040
E) 2040-2050
Transcribed Image Text:Preparing for Automation The possibility of having robots or mechanical assistants completing our laborious, dangerous, or repetitive day-to-day tasks has long been a dream of humanity. Now, as Robotic Process Automation (RPA) becomes commonplace, this dream or concern, depending on viewpoint - is getting closer. RPA, far from the walking, talking android commonly found in science fiction series, can be thought of as a programmable piece of software which, through using a series of rules, will complete repetitive tasks with a lower error rate and less interruption than a human completing the same tasks. The aim of RPA, beyond improving efficiency, is to free up humans from the monotony of roles like data entry, stock…
Details:
A semiconductor manufacturing process creates an average of 0.4 defects per integrated circuit (chip), with the defects occurring independently of each other.
Chapter 14 Solutions
Elementary Statistics Plus MyLab Statistics with Pearson eText -- Title-Specific Access Card Package (13th Edition)
Ch. 14.1 - FAA Requirement Table 14-1 on page 655 lists...Ch. 14.1 - Prob. 2BSCCh. 14.1 - Prob. 3BSCCh. 14.1 - Prob. 4BSCCh. 14.1 - Prob. 5BSCCh. 14.1 - Prob. 6BSCCh. 14.1 - Prob. 7BSCCh. 14.1 - Pepsi Cans. In Exercises 5-8, refer to the axial...Ch. 14.1 - Prob. 9BSCCh. 14.1 - Prob. 10BSC
Ch. 14.1 - Quarters. In Exercises 9-12, refer to the...Ch. 14.1 - Prob. 12BSCCh. 14.1 - Prob. 13BBCh. 14.1 - Prob. 14BBCh. 14.2 - Statistical Literacy and Critical Thinking 1....Ch. 14.2 - Prob. 2BSCCh. 14.2 - Control Limits In constructing a control chart for...Ch. 14.2 - Euro Coins After constructing a control chart for...Ch. 14.2 - Control Charts for p. In Exercises 5-12, use the...Ch. 14.2 - Control Charts for p. In Exercises 5-12, use the...Ch. 14.2 - Prob. 7BSCCh. 14.2 - Control Charts for p. In Exercises 5-12, use the...Ch. 14.2 - Control Charts for p. In Exercises 5-12, use the...Ch. 14.2 - Control Charts for p. In Exercises 5-12, use the...Ch. 14.2 - Control Charts for p. In Exercises 5-12, use the...Ch. 14.2 - Control Charts for p. In Exercises 5-12, use the...Ch. 14.2 - Prob. 13BBCh. 14 - What are process data?Ch. 14 - Prob. 2CQQCh. 14 - Prob. 3CQQCh. 14 - Prob. 4CQQCh. 14 - Prob. 5CQQCh. 14 - Prob. 6CQQCh. 14 - Prob. 7CQQCh. 14 - Prob. 8CQQCh. 14 - Prob. 9CQQCh. 14 - Prob. 10CQQCh. 14 - Prob. 1RECh. 14 - Prob. 2RECh. 14 - Prob. 3RECh. 14 - Energy Consumption. Exercises 15 refer to the...Ch. 14 - Prob. 5RECh. 14 - Prob. 1CRECh. 14 - Prob. 2CRECh. 14 - Prob. 3CRECh. 14 - Internet Doctors: Probability Based on the survey...Ch. 14 - Sunspots and the DJIA Listed below are annual...Ch. 14 - Prob. 6CRECh. 14 - Prob. 7CRECh. 14 - Defective Child Restraint Systems The Tracolyte...Ch. 14 - Prob. 9CRECh. 14 - Does It Pay to Plead Guilty? The accompanying...Ch. 14 - FROM DATA TO DECISION Critical Thinking: Are the...
Knowledge Booster


Learn more about
Need a deep-dive on the concept behind this application? Look no further. Learn more about this topic, statistics and related others by exploring similar questions and additional content below.Similar questions
- a. Compute a weighted 3-month moving average forecast for months 4 through 9. Assign weights 5,3, and 1 to the months in sequence starting with the most recent month. Show your complete and step by step solution and answer.arrow_forwardthe table shows the percent of households with internet access for selected years from 2009 and projected through 2015. Year Percent of households 2009 67 2010 70 2011 72.5 2012 75 2013 76.5 2014 77.2 2015 78 Use the model to predict the percent of households with internet access in 2022.arrow_forwardSuppose a researcher conducted study on the investment and economic growth of Pakistan. He wanted to analyze data of Pakistan since its independence till date (1947 to 2020). But due to the unavailability of data from 1947, researcher only used data from 1990 to 2017. Which of the following part of the research contains this information? a. Background of the study b. Scope of the study c. Limitations of the study d. Significance of the studyarrow_forward
- For the three-part question that follows, provide your answer to each question in the given workspace. Identify each part with a coordinating response. Be sure to clearly label each part of your response as Part A, Part B, and Part C.The populations of two species of insects grow at different rates. At the beginning of a study, Population A had 250 insects and grew at an average rate of 22% per day. Population B had 80 insects and grew at an average rate of 34% per day.Part A: Write functions that model the population increase for the two species of insects. Let x=the number of days since the beginning of the study.Part B: Find the populations of the two species of insects at x=10 days. Show your work.Part C: At 10 days, which population was the largest? How much larger was the population than the other species' population?arrow_forwardQuestion 7 - Part B If 25% of U.S. women have the height lower than 5.1 feet, and 55 % of U.S. women have the weight more than 165 pounds, then 165 is which percentile and 5.1 is which percentile? Write the percintile in the "th" form; ex, 9th percentile, 11th percentile.arrow_forwardAn experimenter wants to study the relationship between type of milk and infant growth in underdeveloped countries. She randomly assigns 300 infants to either a breast-feeding group or an infant formula group. She then weighs the infants every three days for the first four weeks of life.arrow_forward
- The table shows the number of accidents, fatalities, hours and miles flew for U.S. airlines. Year Accidents Fatalities Hours flown Miles flown 2000 59 98 16.7 million 7.1 billions 2005 36 28 18.7 7.8 2010 29 0 17.2 7.3 2015 25 0 17.4 7.6 a. Compute the accident rate per million hours flown in 2000 and 2015. By this measure, has travel on U.S. airlines become safer? b. Compute the accident rate per billion miles flown in 2000 and 2015. By this measure, has travel on U.S. airlines become safer?arrow_forwardpart C D 33000331 UPH-1 St. Lawrence dolomite 618 0.05 2.69 2.74 2.83 48000168 Langer Platteville dolomite 127.8 0.06 2.69 2.75 2.86 52000415 3-21-13z1 Galena dolomite 575 0.04 2.72 2.76 2.83 52000415 3-21-13z1 Platteville dolomite 740 0.05 2.7 2.75 2.85 60000086 VD #1 Silurian dolomite 684 0.03 2.75 2.78 2.83 60000086 VD #1 Galena dolomite 1070 0.05 2.69 2.74 2.84 60000086 VD #1 Platteville dolomite 1142 0.02 2.77 2.79 2.83 13001466 NS-2 Tunnel City sandstone 60.1 0.14 2.41 2.54 2.79 13001466 NS-2 Tunnel City sandstone 60.2 0.28 1.93 2.21 2.67 13001466 NS-2 Tunnel City sandstone 118.3 0.3 1.88 2.18 2.7 33000331 UPH-1 St. Peter sandstone 222 0.22 2.06 2.28 2.65 33000331 UPH-1 Jordan sandstone 531 0.21 2.09 2.3 2.65 33000331 UPH-1 Tunnel City sandstone 644 0.18 2.22 2.4 2.7 33000331 UPH-1 Wonewoc sandstone 735 0.2 2.12 2.32 2.65 33000331 UPH-1 Wonewoc sandstone 840 0.27 1.93 2.2 2.66 33000331 UPH-1 Mt. Simon sandstone 927 0.18 2.31 2.49 2.81…arrow_forwardMachine Technologies, an electric retail company in Durban, has recorded the number of flat –screen TVs sold each week and the number of advertisements placed weekly for a period of 5 weeks. Database of flat-screen TV sales and newspaper advertisements Advertisement 4 4 3 2 5 Sales 26 28 24 18 35 Required: Calculate the Spearmans Rhoarrow_forward
- In a study, the effects of the mane of a male lion as a signal of quality to mates and rivals was explored. Four life-sized dummies of male lions provided a tool for testing female response to the unfamiliar lions whose manes varied by length (long or short) and color (blonde or dark). The female lions were observed to see whether they approached each of the four life-sized dummies. Complete parts (a) through (e) below. a. Identify the experimental units. Choose the correct answer below. The female lions The male dummies The mane colors The mane lengths Part 2 b. Identify the response variable. Choose the correct answer below. A. Whether or not (yes or no) the mane length affected how the female lions reacted to a male dummy. B. Whether or not (yes or no) the female lions approached the same dummies. C. Whether or not (yes or no) the female lions approached a male dummy. D. Whether or not…arrow_forward2.62 For the period 2001–2008, the Bristol-Myers Squibb Company, Inc. reported the following amounts (in billions of dollars) for (1) net sales and (2) advertising and product promotion. The data are also in the file XR02062. Source: Bristol-Myers Squibb Company, Annual Reports, 2005, 2008. Year Net Sales Advertising/Promotion 2001 $16.612 $1.201 2002 16.208 1.143 2003 18.653 1.416 2004 19.380 1.411 2005 19.207 1.476 2006 16.208 1.304 2007 18.193 1.415 2008 20.597 1.550 For these data, construct a line graph that shows both net sales and expenditures for advertising/product promotion over time. Some would suggest that increases in advertising should be accompanied by increases in sales. Does your line graph support this?arrow_forwardItem7 3.33points eBook Item 7 Wenton Powersports produces dune buggies. They have three assembly lines, “Razor,” “Blazer,” and “Tracer,” named after the particular dune buggy models produced on those lines. Each assembly line was originally designed using the same target production rate. However, over the years, various changes have been made to the lines. Accordingly, management wishes to determine whether the assembly lines are still operating at the same average hourly production rate. Production data (in dune buggies/hour) for the last eight hours are as follows. (You may find it useful to reference the F table.) Razor Blazer Tracer 11 11 9 10 9 9 8 11 10 10 10 9 9 11 8 9 10 7 13 11 8 11 8 9 Click here for the Excel Data File a. Specify the competing hypotheses to test whether there are some differences in…arrow_forward
arrow_back_ios
SEE MORE QUESTIONS
arrow_forward_ios
Recommended textbooks for you
 Algebra & Trigonometry with Analytic GeometryAlgebraISBN:9781133382119Author:SwokowskiPublisher:Cengage
Algebra & Trigonometry with Analytic Geometry
Algebra
ISBN:9781133382119
Author:Swokowski
Publisher:Cengage
Learn Algebra 6 : Rate of Change; Author: Derek Banas;https://www.youtube.com/watch?v=Dw701mKcJ1k;License: Standard YouTube License, CC-BY