Concept explainers
Videos
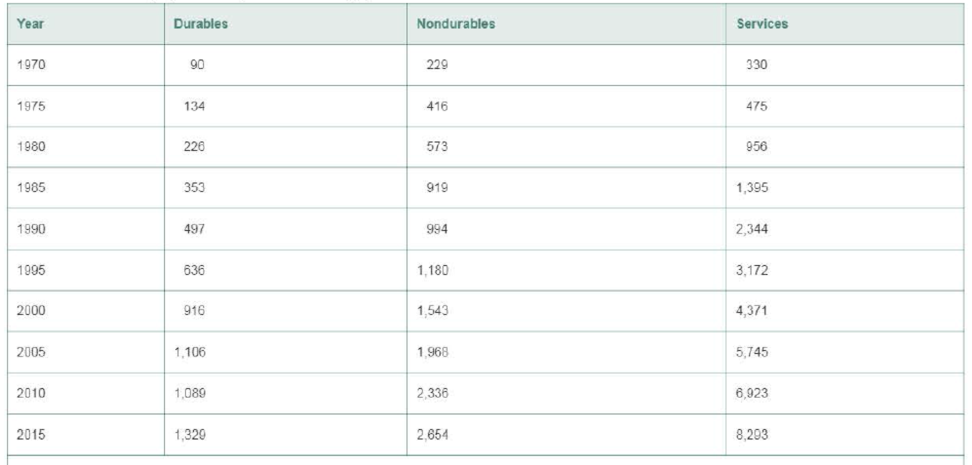
GOP personal consumption expenditures. The gross domestic product (GOP) is the total national output of goods and services valued at market prices. As such, the GOP is a commonly used barometer of the U.S. economy. One component of the GOP is personal consumption expenditures, which is itself the sum of expenditures for durable goods, nondurable goods, and services. The GOP for these components (in billions of dollars) is shown in the next table, in 5-year increments from 1970 to 2015.
a. Using these three component values, construct a simple composite index for the personal consumption component of GOP. Use 1970 as the base year.
b. Suppose we want to update the index by using 1980 as the base year. Update the index using only the index values you calculated in part a, without referring to the original data.
c. Graph the personal consumption expenditure index for the years 1960-2015, first using 1970 as the base year and then using 1980 as the base year. What effect does changing the base year have on the graph of this index?
Want to see the full answer?
Check out a sample textbook solution
Chapter 14 Solutions
Statistics, Books a la Carte Edition (13th Edition)


 Linear Algebra: A Modern IntroductionAlgebraISBN:9781285463247Author:David PoolePublisher:Cengage Learning