Concept explainers
Videos
Graphing calculator sales. The next table presents the quarterly sales index for one brand of graphing calculator at a campus bookstore. The quarters are based on an academic year, so the first quarter represents fall; the second, winter; the third, spring; and the fourth, summer. Define the time variable as t = 1 for the first quarter of 2011, t = 2 for the second quarter of 2011, etc. Consider the following seasonal dummy variables:
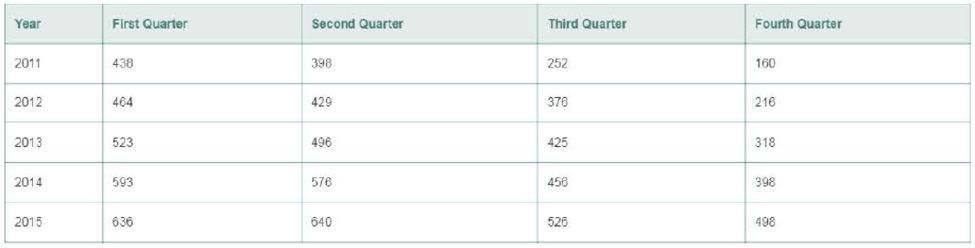
a. Write a regression model for E (Yt) as a
b. Find and interpret the least squares estimates and evaluate the usefulness of the model.
c. Which of the assumptions about the random error component is in doubt when a regression model is fit to time series data?
d. Find the forecasts and the 95% prediction intervals for the 2016 quarterly sales. Interpret the result.
Want to see the full answer?
Check out a sample textbook solution
Chapter 14 Solutions
Statistics, Books a la Carte Edition (13th Edition)


- A company with a high operating leverage will experience which of the following? a) the same percentage change in operating income as a result of a percentage change in sales. b) a small percentage change in operating income as a result of a small percentage change in sales. c) a large percentage change in operating income as a result of a small percentage change in sales. d) a small percentage change in operating income as a result of a large percentage change in sales.arrow_forwardThe manager of a seafood restaurant was asked to establish a pricing policy on lobster dinners. The manager intends to use the pricing $/LB to predict the lobster sales on each day. The pertinent historical data are collected as shown in the table. Anaswer the following questions. Day Lobster Sold/day Price ($/lb.) 1 171 7.0 2 181 5.2 3 170 6.5 4 179 7.9 5 165 7.0 6 150 5.8 7 178 7.3 x = independent variable. According to this problem, the ∑x = 46.7r i s the coeefficient of correlation. Use the r equation to compute the value of the denominator part of the equation. The value for the r denominator = 414.1142According to this problem, the correlation of coefficient, r, between the two most pertinent variables is = 0.2707a) According to the instructor's lecture, the correlation strength between any two variables can be described as strong , weak , or no correlation. The correlation strength for this problem can be…arrow_forwardClassify each of the following variables by their level of measurement. Temperature, in degrees Celsius ordinal /Nominal /internal/Ratio The wingspan of bees at a specific apiary ordinal /Nominal /internal/Ratio Patients' eye colours ordinal /Nominal /internal/Ratio The spiciness of dishes at a TexMex restaurant, rated in number of chili peppers ordinal /Nominal /internal/Ratio Survey feedback rated either (1) strongly agree- (2) agree- (3) neither agree nor disagree- (4) disagree- (5) strongly disagree ordinal /Nominal /internal/Ratio The attractiveness of instructors on RateMyProf, rated in number of chili peppers ordinal /Nominal /internal/Ratio The health of a tree, measured by the robustness of its appearance ordinal /Nominal /internal/Ratio Patient names ordinal /Nominal /internal/Ratio The distance jumped by a track & field athlete ordinal /Nominal /internal/Ratio Shoe size ordinal /Nominal /internal/Ratio The health of a tree,…arrow_forward
- The manager of a seafood restaurant was asked to establish a pricing policy on lobster dinners. The manager intends to use the pricing $/LB to predict the lobster sales on each day. The pertinent historical data are collected as shown in the table. Anaswer the following questions. Day Lobster Sold/day Price ($/lb.) 1 171 7.0 2 181 5.2 3 170 6.5 4 179 7.9 5 165 7.0 6 150 5.8 7 178 7.3 a) x = independent variable. According to this problem, the ∑x = b) r i s the coeefficient of correlation. Use the r equation to compute the value of the denominator part of the equation. The value for the r denominator = (in 4 decimal places)c) According to this problem, the correlation of coefficient, r, between the two most pertinent variables is = (in 4 decimal places).d) According to the instructor's lecture, the correlation strength between any two variables can be described as strong , weak , or no correlation. The correlation…arrow_forwardGoogle has changed its strategy with regard to how much and over which media it invests in advertising. The following table shows Google's marketing budget in millions of dollars for 2008 and 2011 (The Wall Street Journal, March 27, 2012). 2008 2011 Internet $26.0 $123.3 Newspaper, etc. $4.0 $20.7 Television $0.0 $69.3 a. Select a side-by-side bar chart with year as the variable on the horizontal axis.arrow_forwardWhich of the following would cause FOBT to increase A. An increase in the difference between the means b. An increase in the magnitude of the independent variables affect c. An increase in the difference between the means and an increase in the within groups variability d. An increase in the difference between the means and an increase in the magnitude of the independent variables of effect e. An increase in the within-groups variabilityarrow_forward
- For each of the following situations, state the independent variable and the dependent variable. a. A study is done to determine if elderly drivers are involved in more motor vehicle fatalities than other drivers. The number of fatalities per 100,000 drivers is compared to the age of drivers. b. A study is done to determine if the weekly grocery bill changes based on the number of family members. c. Insurance companies base life insurance premiums partially on the age of the applicant. d. Utility bills vary according to power consumption. e. A study is done to determine if a higher education reduces the crime rate in a population.arrow_forwardWhich of the following time periods will have the largest annual average increase in the percentage of jobs that could be fully automated (based on the provided images attached)? A) 2020-2028 B) 2028-2030 C) 2030-2035 D) 2035-2040 E) 2040-2050 Transcribed Image Text:Preparing for Automation The possibility of having robots or mechanical assistants completing our laborious, dangerous, or repetitive day-to-day tasks has long been a dream of humanity. Now, as Robotic Process Automation (RPA) becomes commonplace, this dream or concern, depending on viewpoint - is getting closer. RPA, far from the walking, talking android commonly found in science fiction series, can be thought of as a programmable piece of software which, through using a series of rules, will complete repetitive tasks with a lower error rate and less interruption than a human completing the same tasks. The aim of RPA, beyond improving efficiency, is to free up humans from the monotony of roles like data entry, stock…arrow_forwardThe activities required to service a car at the Exclusive Car Mart is summarised in the following table: Table 1: Activity Times and Predecessors Minutes Required Activity Description Predecessor Activity Optimistic a Most Likely m Pessimistic b A B C D E F G H Drain Oil Replace Filter Refill Oil Check Tyres Wash Windows Fill Fluids Service A/c Final Test --- A B, E --- D E C C, F 3 2 3 3 4 4 3 1.5 4.5 3 4.5 4 3 4 3 2 7 5 6 6 7 6 5 3.5 The variability in times required to perform each activity is due to the different types, sizes, and conditions of the cars to be serviced. Required Draw the activity network for this problem (either AON or AOA) Determine the Expected Time and Variance for each activity. Round to 2 decimal places where applicable. Show the activity schedule (ES, EF, LS, and LF) as well as slack. Determine and state the critical path for this project. This must be based on your work in c) and not by inspection.…arrow_forward
- State the type of variable in each of the following cases 1- 5.1. The weight (Kg) of an Amazon package.2. The stress level (Low, Average, High) of a student taking this exam.3. The number of Long Covid-19 patients in England in 2021.4. Type of vaccine (Pfizer, AstraZeneca, Moderna).5. The annual profits (£m) of the JSA company in 2021.Your answer should be A, or B or C or D, where A, B, C, and D are defined asfollows:A. Numerical and DiscreteB. Numerical and ContinuousC. Categorical and NominalD. Categorical and Ordinalarrow_forwardDetermine the X and Y variables for each of the following. a) A researcher wishes to determine what happens to creativity scores as participants' intelligence scores increase. b) A researcher wants to know if there is a relationship between hours of sleep students usually get and their GPA. The researcher believes that students who get more sleep will have a higher GPA. c) A researcher thinks that as a person's stress level increases, their impulse buying also increases.arrow_forwardIf there is no seasonal effect on human births, one would expect equal numbers of children to be born in each season (winter, spring, summer, and fall). A student takes a census of her statistics class and finds that of the 120 students in the class, 26 were born in winter, 37 in spring, 31 in summer, and 26 in fall. She wonders if the excess in the spring is an indication that births are not uniform throughout the year. Complete parts a) through c) below. A. What is the expected number of births in each season if there is no "seasonal effect" on births? B. Compute the chi squared-statistic. C. How many degrees of freedom does the chi squared-statistic have?arrow_forward
 MATLAB: An Introduction with ApplicationsStatisticsISBN:9781119256830Author:Amos GilatPublisher:John Wiley & Sons Inc
 Probability and Statistics for Engineering and th...StatisticsISBN:9781305251809Author:Jay L. DevorePublisher:Cengage Learning
 Statistics for The Behavioral Sciences (MindTap C...StatisticsISBN:9781305504912Author:Frederick J Gravetter, Larry B. WallnauPublisher:Cengage Learning
 Elementary Statistics: Picturing the World (7th E...StatisticsISBN:9780134683416Author:Ron Larson, Betsy FarberPublisher:PEARSON
 The Basic Practice of StatisticsStatisticsISBN:9781319042578Author:David S. Moore, William I. Notz, Michael A. FlignerPublisher:W. H. Freeman
 Introduction to the Practice of StatisticsStatisticsISBN:9781319013387Author:David S. Moore, George P. McCabe, Bruce A. CraigPublisher:W. H. Freeman