
Concept explainers
Videos
Price and Quality of Headphones. The following data show the brand, price ($), and the overall score for six stereo headphones that were tested by Consumer Reports (Consumer Reports website). The overall score is based on sound quality and effectiveness of ambient noise reduction. Scores
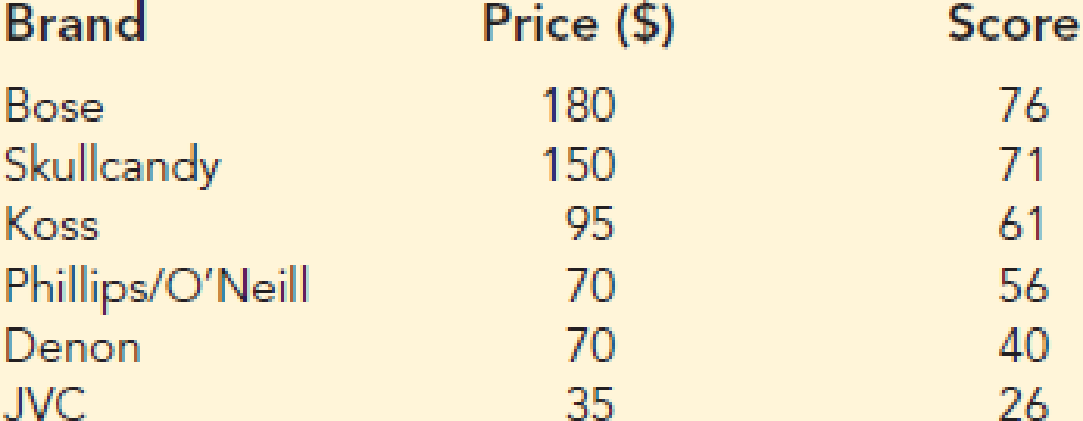
- a. Compute SST, SSR, and SSE.
- b. Compute the coefficient of determination r2. Comment on the goodness of fit.
- c. What is the value of the sample
correlation coefficient ?

Trending nowThis is a popular solution!

Chapter 14 Solutions
MindTap Business Statistics, 1 term (6 months) Printed Access Card for Anderson/Sweeney/Williams/Camm/Cochran's Essentials of Statistics for Business and Economics, 8th


- If your graphing calculator is capable of computing a least-squares sinusoidal regression model, use it to find a second model for the data. Graph this new equation along with your first model. How do they compare?arrow_forwardcreate graph of the two-variable data with a regression line, r, r2, and separate residual plotarrow_forwardThe following data table shows the historical data for the first semester 2020, of the amount of sales of the company "IRC", which sells sneakers. Utilizing multiple lineal regression (as shown on the image), find an equation that estimates the number of sneakers sold by the company, based on advertising and revenue. Also, determine the standard error of estimation, the coefficient of determination, and the correlation coefficient. Write down what was the quantity in thousands sold in July if the amount of ads was 8 and the income for each unit was $135arrow_forward
- What is the equation of the regression linearrow_forwardA researcher investigated the relationship between family income and savings. Using data from 15 families, the computed r between income and savings was found to be 0.76. The researcher wants to test if there is a significant relationship between the two variables at 5% level of significance and create a regression equation to predict the possible savings given the income of the family. Interpret the computed r value. Test if there is a significant relationship between the two variables at 5% level of significancearrow_forwardHow are the slope and intercept of a simple linear regression line calculated? What do they tell us about the relationship between the two variables?arrow_forward
- Assume that you want to predict Company Performance based on the linear effects of Trust and Commitment that exist among a company’s employees c) If you want to test whether there is a linear effect of Commitment and a curvilinear effect of Trust on Company Performance—such that Company Performance increases up to a certain level of Trust, after which Company Performance diminishes with increasing Trust levels—how would your regression equation look like? Further, explain your answer in your own words. Provide at least two sentences of explanation, in addition to giving the regression equation.arrow_forwardMarina, Elena, Paloma, Alejandra and Rocío are 2, 3, 5, 7 and 8 years old and weigh 14, 20, 30, 42 and 44 kg respectively. With these data:(a) Find the equation of the regression line of age on weight.b) Estimate the approximate "weight" for a 6-year-old girl.arrow_forward** had to resubmit this question because the first time the data was duplicated and reflected incorrectly. The table below gives the number of hours spent unsupervised each day as well as the overall grade averages for seven randomly selected middle school students. Using this data, consider the equation of the regression line, yˆ=b0+b1xy^=b0+b1x, for predicting the overall grade average for a middle school student based on the number of hours spent unsupervised each day. Keep in mind, the correlation coefficient may or may not be statistically significant for the data given. Remember, in practice, it would not be appropriate to use the regression line to make a prediction if the correlation coefficient is not statistically significant. Hours Unsupervised 1 2 3 4 5 5.5 6 Overall Grades 96 89 87 77 76 68 64 **Please circle the answer for each step so I don't get confused. Thanks in advance for helping me with the breakdown and notes** Step 1 of 6 : Find the…arrow_forward
- The table below gives the number of hours five randomly selected students spent studying and their corresponding midterm exam grades. Using this data, consider the equation of the regression line, yˆ=b0+b1xy^=b0+b1x, for predicting the midterm exam grade that a student will earn based on the number of hours spent studying. Keep in mind, the correlation coefficient may or may not be statistically significant for the data given. Remember, in practice, it would not be appropriate to use the regression line to make a prediction if the correlation coefficient is not statistically significant. Hours of studying 0 1 2 4 5 Midterm Grades 67 77 83 97 99 Find the estiamted slope. round answer 3 decimal placesarrow_forwardThe table below gives the number of hours five randomly selected students spent studying and their corresponding midterm exam grades. Using this data, consider the equation of the regression line, yˆ=b0+b1xy^=b0+b1x, for predicting the midterm exam grade that a student will earn based on the number of hours spent studying. Keep in mind, the correlation coefficient may or may not be statistically significant for the data given. Remember, in practice, it would not be appropriate to use the regression line to make a prediction if the correlation coefficient is not statistically significant. Hours Studying 0 1 2 4 5 Midterm grades 67 77 83 97 99 find the y intercept and round to three decimal placesarrow_forwardThe table below gives the number of hours five randomly selected students spent studying and their corresponding midterm exam grades. Using this data, consider the equation of the regression line, yˆ=b0+b1xy^=b0+b1x, for predicting the midterm exam grade that a student will earn based on the number of hours spent studying. Keep in mind, the correlation coefficient may or may not be statistically significant for the data given. Remember, in practice, it would not be appropriate to use the regression line to make a prediction if the correlation coefficient is not statistically significant. hours studying 0 1 3 4 5 grades 63 65 80 81 87 Calculate the correlation coefficient, r. Round your answer to three decimal places.arrow_forward
 Trigonometry (MindTap Course List)TrigonometryISBN:9781305652224Author:Charles P. McKeague, Mark D. TurnerPublisher:Cengage Learning