
Statistics: The Art and Science of Learning From Data, Books a la Carte Edition (4th Edition)
4th Edition
ISBN: 9780133860825
Author: Alan Agresti, Christine A. Franklin, Bernhard Klingenberg
Publisher: PEARSON
expand_more
expand_more
format_list_bulleted
Concept explainers
Videos
Textbook Question
Chapter 14.3, Problem 35PB
Regression of weight gain on diet Refer to the previous exercise.
- a. Set up indicator variables for protein source and for protein level and specify a regression model with the effects both of protein level and protein source on weight gain.
- b. Fit the model in part a and explain how to interpret the parameter estimate for the protein level indicator variable.
- c. Show how you could test a hypothesis about beta parameters in the model in part a to analyze the effect of protein source on weight gain.
- d. Using the fit of the model, find the estimated mean for each of the six diets. Explain what it means when we say that these estimated means do not allow for interaction between protein level and source in their effects on weight loss.
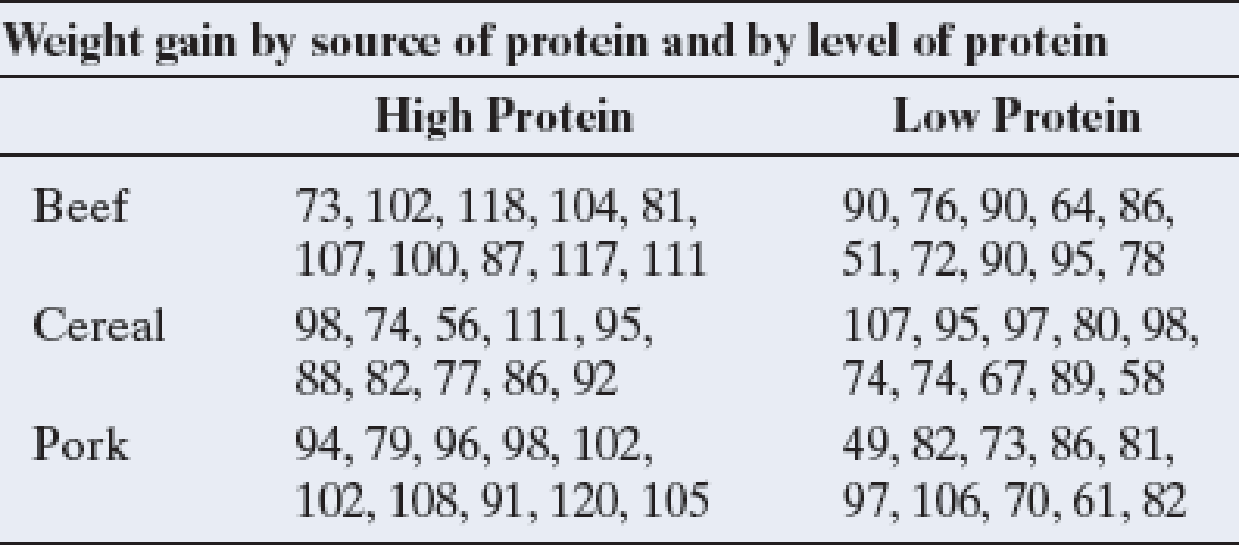
14.34 Diet and weight gain A randomized experiment4 measured weight gain (in grams) of male rats under six diets varying by source of protein (beef, cereal, pork) and level of protein (high, low). Ten rats were assigned to each diet. The data are shown in the table that follows and are also available in the Protein and Weight Gain data file on the book’s website.
- a. Conduct a two-way ANOVA that assumes a lack of interaction. Report the F test statistic and the P-value for testing the effect of the protein level. Interpret.
- b. Now conduct a two-way ANOVA that also considers potential interaction. Report the hypotheses, test statistic, and P-value for a test of no interaction. What do you conclude at the 0.05 significance level? Explain.
- c. Refer to part b. Allowing interaction, construct a 95% confidence interval to compare the mean weight gain for the two protein levels, for the beef source of protein.
Expert Solution & Answer
Want to see the full answer?
Check out a sample textbook solution
Students have asked these similar questions
I set up a multiple linear regression model to explain returns on BA as a linear function of market returns, and size and value. Note that the data is in levels ( not in logs) I interpret the beta of market as
Select one:
a.
the impact of a one unit variation of market on BA returns on average
b.
the impact of a one unit % chnage in market on the BA returns on average keeping size and value fixed
c.
the relation between BA returns and market
d.
the impact of a one percentage variation of market on BA returns on average in percentage
e.
the impact of a one unit variation in market on the BA returns on average keeping size and value fixed
The following data shows memory scores collected from adults of different ages.
Age (X)
Memory Score (Y)
25
10
32
10
39
9
48
9
56
7
Use the data to find the regression equation for predicting memory scores from age.
The regression equation is:
Ŷ = 4.33X + 0.11
Ŷ = -0.11X + 4.33
Ŷ = -0.11X + 13.26
Ŷ = -0.09X + 5.4
Ŷ = -0.09X + 12.6
Use the regression equation you found in question 6 to find the predicted memory scores for the following age: 28
For the calculations, leave two places after the decimal point and do not round:
Use the regression equation you found in question 6 to find the predicted memory scores for the following age: 43
For the calculations, leave two places after the decimal point and do not round:
Use the regression equation you found in question 6 to find the predicted memory scores for the following age: 50
For the calculations, leave two places after the decimal point and do not round:
Using the data given in the Question about Correlation between numbers
of commuters and numbers of parking spaces, find the equation of the
regression line in which the explanatory variable (or x variable) is the
numbers of commuters and the response variable (or y variable) is the
numbers of parking spaces.
Chapter 14 Solutions
Statistics: The Art and Science of Learning From Data, Books a la Carte Edition (4th Edition)
Ch. 14.1 - Hotel satisfaction The CEO of a company that owns...Ch. 14.1 - Prob. 2PBCh. 14.1 - Whats the best way to learn French? The following...Ch. 14.1 - Prob. 4PBCh. 14.1 - Prob. 5PBCh. 14.1 - ANOVA and box plots For two studies, each...Ch. 14.1 - Prob. 7PBCh. 14.1 - Smoking and personality A study about smoking and...Ch. 14.1 - Prob. 9PBCh. 14.1 - Prob. 10PB
Ch. 14.1 - Prob. 11PBCh. 14.2 - House prices and age For the House Selling Prices...Ch. 14.2 - Time on Facebook Do freshmen spent significantly...Ch. 14.2 - Prob. 14PBCh. 14.2 - Tukey holding time comparisons Refer to the...Ch. 14.2 - Prob. 16PBCh. 14.2 - REM regression Refer to the previous exercise. a....Ch. 14.2 - Prob. 18PBCh. 14.2 - Regression for outsourcing Refer to the previous...Ch. 14.2 - Advertising effect oil sales Each of 100...Ch. 14.3 - Reducing cholesterol An experiment randomly...Ch. 14.3 - Prob. 24PBCh. 14.3 - Political ideology in 2014 The GSS measures...Ch. 14.3 - Prob. 26PBCh. 14.3 - Corn and manure In Example 10, the coefficient of...Ch. 14.3 - Prob. 28PBCh. 14.3 - Regression for telephone holding times Refer to...Ch. 14.3 - Prob. 30PBCh. 14.3 - Income by gender and degree In 2012, the...Ch. 14.3 - Prob. 32PBCh. 14.3 - Attractiveness and getting dates The results in...Ch. 14.3 - Prob. 34PBCh. 14.3 - Regression of weight gain on diet Refer to the...Ch. 14 - Good friends and marital status Is the number of...Ch. 14 - Prob. 37CPCh. 14 - Singles watch more TV The 2014 General Social...Ch. 14 - Prob. 39CPCh. 14 - Prob. 40CPCh. 14 - Prob. 41CPCh. 14 - Prob. 42CPCh. 14 - Prob. 43CPCh. 14 - Comparing therapies for anorexia The Anorexia data...Ch. 14 - Prob. 45CPCh. 14 - Prob. 46CPCh. 14 - Prob. 47CPCh. 14 - Prob. 48CPCh. 14 - Prob. 49CPCh. 14 - Prob. 50CPCh. 14 - Prob. 51CPCh. 14 - TV watching by gender and race When we use the...Ch. 14 - Prob. 53CPCh. 14 - Prob. 54CPCh. 14 - Prob. 55CPCh. 14 - Prob. 56CPCh. 14 - Prob. 57CPCh. 14 - Prob. 59CPCh. 14 - Prob. 60CPCh. 14 - Prob. 61CPCh. 14 - Prob. 62CPCh. 14 - Prob. 63CPCh. 14 - Prob. 64CPCh. 14 - Prob. 65CPCh. 14 - Prob. 66CPCh. 14 - Prob. 67CPCh. 14 - Prob. 68CPCh. 14 - Prob. 69CPCh. 14 - Prob. 70CPCh. 14 - Prob. 71CP
Knowledge Booster


Learn more about
Need a deep-dive on the concept behind this application? Look no further. Learn more about this topic, statistics and related others by exploring similar questions and additional content below.Similar questions
- Life Expectancy The following table shows the average life expectancy, in years, of a child born in the given year42 Life expectancy 2005 77.6 2007 78.1 2009 78.5 2011 78.7 2013 78.8 a. Find the equation of the regression line, and explain the meaning of its slope. b. Plot the data points and the regression line. c. Explain in practical terms the meaning of the slope of the regression line. d. Based on the trend of the regression line, what do you predict as the life expectancy of a child born in 2019? e. Based on the trend of the regression line, what do you predict as the life expectancy of a child born in 1580?2300arrow_forwardFind the equation of the regression line for the following data set. x 1 2 3 y 0 3 4arrow_forwardOlympic Pole Vault The graph in Figure 7 indicates that in recent years the winning Olympic men’s pole vault height has fallen below the value predicted by the regression line in Example 2. This might have occurred because when the pole vault was a new event there was much room for improvement in vaulters’ performances, whereas now even the best training can produce only incremental advances. Let’s see whether concentrating on more recent results gives a better predictor of future records. (a) Use the data in Table 2 (page 176) to complete the table of winning pole vault heights shown in the margin. (Note that we are using x=0 to correspond to the year 1972, where this restricted data set begins.) (b) Find the regression line for the data in part ‚(a). (c) Plot the data and the regression line on the same axes. Does the regression line seem to provide a good model for the data? (d) What does the regression line predict as the winning pole vault height for the 2012 Olympics? Compare this predicted value to the actual 2012 winning height of 5.97 m, as described on page 177. Has this new regression line provided a better prediction than the line in Example 2?arrow_forward
- XYZ Corporation Stock Prices The following table shows the average stock price, in dollars, of XYZ Corporation in the given month. Month Stock price January 2011 43.71 February 2011 44.22 March 2011 44.44 April 2011 45.17 May 2011 45.97 a. Find the equation of the regression line. Round the regression coefficients to three decimal places. b. Plot the data points and the regression line. c. Explain in practical terms the meaning of the slope of the regression line. d. Based on the trend of the regression line, what do you predict the stock price to be in January 2012? January 2013?arrow_forwardLillian conducted a small survey of her friends and family. She asked them how many hours per week they spend reading digital documents (newspapers, blogs, books, etc.), and their age. She created the scatter plot below with the results she obtained. Draw the regression line that best represents this scatter plot and determine its equation.arrow_forwardA study is to be made regarding the demand for sneakers and the relationship with their price. The data are as follows: Sneakers Demand Price (USD) 4 2 6 2 6 4 7 4 8 5 7 5 8 6 It is requested: Calculate the parameters β1 and β2. Interpret each one Determine the regression line.arrow_forward
- The accompanying data represent the weights of various domestic cars and their gas mileages in the city. The linear correlation coefficient between the weight of a car and its miles per gallon in the city is r= - 0.977. The least-squares regression line treating weight as the explanatory variable and miles per gallon as the response variable is -0.0061x +41.3297. Complete parts (a) and (b) below. V = Click the icon to view the data table. (a) What proportion of the variability in miles per gallon is explained by the relation between weight of the car and miles per gallon? The proportion of the variability in miles per gallon explained by the relation between weight of the car and miles per gallon is %. (Round to one decimal place as needed.) (b) Interpret the coefficient of determination. % of the variance in is by the linear model. (Round to one decimal place as needed.) Data Table Full data set Miles per Miles per Weight (pounds), x Weight (pounds), x Car Car Gallon, y Gallon, y 1…arrow_forwardSee the attached images for both the introduction and the question.arrow_forwardA materials engineer working for a furniture manufacturer wants to evaluate the rigidity of the particle board used by the manufacturer. The engineer collects stiffness data from pieces of particle board that have different densities at different temperatures. Determine the connection between the stiffness and the density of the wood. What does Pierson's r tell us? What is the regression between the stiffness and the density of the wood? Write the equation of the linear regression? density rigidity Temp 9.5 14.814 70.61056 8.4 17.502 73.34893 9.8 14.007 66.15377 11 19.443 70.05781 8.3 7.573 69.33919 9.9 14.191 69.12882 8.6 9.714 69.83351 6.4 8.076 64.36617 7 5.304 65.41039 8.2 10.728 67.76739 17.4 43.243 69.70053 15 25.319 66.93095 15.2 28.028 71.52362 16.4 41.792 66.60748 16.7 49.499 67.98685 15.4 25.312 64.29324 15 26.222 64.48343 14.5 22.148 71.3084 14.8 26.751 69.58755 13.6 18.036 71.13321 25.6 96.305 72.09707 24.4 72.594 67.32207…arrow_forward
- Draw a scatter diagram for the above data Obtain the regression equation by using least square method Predict the price of a house with a size of 28 square feetarrow_forwardwhy the correct answer is letter b?arrow_forwardFor the provided data, develop a regression model for overall satisfaction as a function of years of service and department that has the largest R. Note that the categorical variable department has multiple levels and will require the use of multiple dummy variables. Which department, if any, has the highest impact on roduction satisfaction? Production Production E Click the icon to view the job satisfaction data. Determine the regression model for overall satisfaction as a function of years of service and department that has the largest R. Let "Administrative" be the baseline department, let X, represent Maintenance, let X, represent Management, let X, represent Production, let X, represent Quality Control, and let Xg represent Shipping / Receiving, coding each department variable with a 1 if the person is in that department and 0 otherwise. In addition, let Xe represent Years. Enter the terms of the equation so that the X-values are in ascending numerical order by base. Select the…arrow_forward
arrow_back_ios
SEE MORE QUESTIONS
arrow_forward_ios
Recommended textbooks for you
 College AlgebraAlgebraISBN:9781305115545Author:James Stewart, Lothar Redlin, Saleem WatsonPublisher:Cengage Learning
 Functions and Change: A Modeling Approach to Coll...AlgebraISBN:9781337111348Author:Bruce Crauder, Benny Evans, Alan NoellPublisher:Cengage Learning
 Algebra and Trigonometry (MindTap Course List)AlgebraISBN:9781305071742Author:James Stewart, Lothar Redlin, Saleem WatsonPublisher:Cengage Learning
 Elementary Linear Algebra (MindTap Course List)AlgebraISBN:9781305658004Author:Ron LarsonPublisher:Cengage Learning
 Glencoe Algebra 1, Student Edition, 9780079039897...AlgebraISBN:9780079039897Author:CarterPublisher:McGraw Hill
College Algebra
Algebra
ISBN:9781305115545
Author:James Stewart, Lothar Redlin, Saleem Watson
Publisher:Cengage Learning
Functions and Change: A Modeling Approach to Coll...
Algebra
ISBN:9781337111348
Author:Bruce Crauder, Benny Evans, Alan Noell
Publisher:Cengage Learning
Algebra and Trigonometry (MindTap Course List)
Algebra
ISBN:9781305071742
Author:James Stewart, Lothar Redlin, Saleem Watson
Publisher:Cengage Learning
Elementary Linear Algebra (MindTap Course List)
Algebra
ISBN:9781305658004
Author:Ron Larson
Publisher:Cengage Learning
Glencoe Algebra 1, Student Edition, 9780079039897...
Algebra
ISBN:9780079039897
Author:Carter
Publisher:McGraw Hill
Correlation Vs Regression: Difference Between them with definition & Comparison Chart; Author: Key Differences;https://www.youtube.com/watch?v=Ou2QGSJVd0U;License: Standard YouTube License, CC-BY
Correlation and Regression: Concepts with Illustrative examples; Author: LEARN & APPLY : Lean and Six Sigma;https://www.youtube.com/watch?v=xTpHD5WLuoA;License: Standard YouTube License, CC-BY