
Introductory Statistics, Books a la Carte Plus NEW MyLab Statistics with Pearson eText -- Access Card Package (10th Edition)
10th Edition
ISBN: 9780134270364
Author: Neil A. Weiss
Publisher: PEARSON
expand_more
expand_more
format_list_bulleted
Concept explainers
Videos
Textbook Question
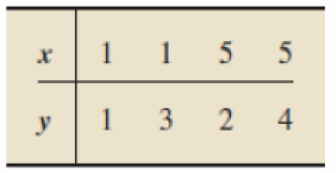
Chapter 14.4, Problem 142E
In Exercises 14.134–14.143, we repeat data from exercises in Section 14.2. For each exercise, determine the linear
- a. Definition 14.8 on page 645.
- b. Formula 14.3 on page 647.
Compare your answers in parts (a) and (b).
14.142
Expert Solution & Answer
Want to see the full answer?
Check out a sample textbook solution
Students have asked these similar questions
please solve parts d e f
2.31 The median income for a four-person family has been reported as shown here for 1993–2003.
Source: Time Almanac 2006, p. 627.
1993 $45,161 1999 $59,981 1998 56,061
1994 47,012 2000 62,228
1995 49,687 2001 63,278
1996 51,518 2002 62,732
1997 53,350 2003 65,093
Construct a line graph describing these data over time.
Regression and Predictions. Exercises 13–28 use the same data sets as Exercises 13–28 in Section 10-1. In each case, find the regression equation, letting the first variable be the predictor (x) variable. Find the indicated predicted value by following the prediction procedure summarized in Figure 10-5 on page 493.
Crickets and Temperature Find the best predicted temperature at a time when a cricket chirps 3000 times in 1 minute. What is wrong with this predicted temperature?
Chapter 14 Solutions
Introductory Statistics, Books a la Carte Plus NEW MyLab Statistics with Pearson eText -- Access Card Package (10th Edition)
Ch. 14.1 - Regarding linear equations with one independent...Ch. 14.1 - Prob. 2ECh. 14.1 - Consider the linear equation y = b0 + b1x. a....Ch. 14.1 - Prob. 4ECh. 14.1 - In Exercises 14.514.14, we give linear equations....Ch. 14.1 - Prob. 6ECh. 14.1 - In Exercises 14.5-14.14, we give linear equations....Ch. 14.1 - Prob. 8ECh. 14.1 - Prob. 9ECh. 14.1 - In Exercises 14.514.14, we give linear equations....
Ch. 14.1 - Prob. 11ECh. 14.1 - Prob. 12ECh. 14.1 - Prob. 13ECh. 14.1 - Prob. 14ECh. 14.1 - In Exercises 14.1514.22,we identify the...Ch. 14.1 - Prob. 16ECh. 14.1 - Prob. 17ECh. 14.1 - Prob. 18ECh. 14.1 - Prob. 19ECh. 14.1 - Prob. 20ECh. 14.1 - Prob. 21ECh. 14.1 - Prob. 22ECh. 14.1 - Rental-Car Costs. During one month, the Avis...Ch. 14.1 - Air-Conditioning Repairs. Richards Healing and...Ch. 14.1 - Measuring Temperature. The two most commonly used...Ch. 14.1 - A Law of Physics. A ball is thrown straight up in...Ch. 14.1 - Prob. 27ECh. 14.1 - Prob. 28ECh. 14.1 - Prob. 29ECh. 14.1 - Prob. 30ECh. 14.1 - Prob. 31ECh. 14.1 - Road Grade. The grade of a road is defined as the...Ch. 14.1 - Vertical Lines. In this section, we stated that...Ch. 14.2 - Regarding a scatterplot, a. identify one of its...Ch. 14.2 - Regarding the criterion used to decide on the line...Ch. 14.2 - Regarding the line that best fits a set of data...Ch. 14.2 - Regarding the two variables under consideration in...Ch. 14.2 - Using the regression equation to make predictions...Ch. 14.2 - Fill in the blanks. a. In the context of...Ch. 14.2 - For which of the following sets of data points can...Ch. 14.2 - For which of the following sets of data points can...Ch. 14.2 - In each of Exercises 14.4214.45, we have presented...Ch. 14.2 - In each of Exercises 14.4214.45, we have presented...Ch. 14.2 - In each of Exercises 14.4214.45, we have presented...Ch. 14.2 - In each of Exercises 14.4214.45, we have presented...Ch. 14.2 - For a data set consisting of two data points: a....Ch. 14.2 - Prob. 47ECh. 14.2 - In each of Exercises 14.4814.57, a. find the...Ch. 14.2 - In each of Exercises 14.4814.57. a. find the...Ch. 14.2 - In each of Exercises 14.4814.57, a. find the...Ch. 14.2 - In each of Exercises 14.48-14.57, a. find the...Ch. 14.2 - In each of Exercises 14.4814.57, a. find the...Ch. 14.2 - In each of Exercises 14.4814.57, a. find the...Ch. 14.2 - In each of Exercises 14.48-14.57, a. find the...Ch. 14.2 - In each of Exercises 14.4814.57. a. find the...Ch. 14.2 - In each of Exercises 14.4814.57. a. find the...Ch. 14.2 - In each of Exercises 14.4814.57. a. find the...Ch. 14.2 - Prob. 58ECh. 14.2 - In each of Exercises 14.5814.63, a. find the...Ch. 14.2 - In each of Exercises 14.5814.63. a. find the...Ch. 14.2 - In each of Exercises 14.5814.63, a. find the...Ch. 14.2 - In each of Exercises 14.5814.63. a. find the...Ch. 14.2 - In each of Exercises 14.5814.63, a. find the...Ch. 14.2 - Tax Efficiency. In Exercise 14.58, you determined...Ch. 14.2 - Corvette Prices. In Exercise 14.59, you determined...Ch. 14.2 - Anscombes Quartet. In the article Graphs in...Ch. 14.2 - Study Time and Score. The negative relation...Ch. 14.2 - Age and Price of Orions. In Table 14.2, we...Ch. 14.2 - Wasp Mating Systems. In the paper "Mating System...Ch. 14.2 - In Exercises 14.7014.80, use the technology of...Ch. 14.2 - In Exercises 14.7014.80, use the technology of...Ch. 14.2 - In Exercises 14.7014.80, use the technology of...Ch. 14.2 - In Exercises I4.7014.80, use the technology of...Ch. 14.2 - In Exercises 14.7014.80, use the technology of...Ch. 14.2 - In Exercises 14.7014.80, use the technology of...Ch. 14.2 - Prob. 76ECh. 14.2 - Prob. 77ECh. 14.2 - Prob. 78ECh. 14.2 - Prob. 79ECh. 14.2 - In Exercises 14.7014.80, use the technology of...Ch. 14.2 - Prob. 81ECh. 14.2 - Time Series. A collection of observations of a...Ch. 14.3 - In this section, we introduced a descriptive...Ch. 14.3 - A measure of total variation in the observed...Ch. 14.3 - A measure of the amount of variation in the...Ch. 14.3 - A measure of the amount of variation in the...Ch. 14.3 - Prob. 87ECh. 14.3 - In Exercises 14.8814.97, we repeal the data and...Ch. 14.3 - In Exercises14.481497, we repeal the tiara and...Ch. 14.3 - In Exercises 14.8814.97, we repeat the data and...Ch. 14.3 - Prob. 91ECh. 14.3 - Prob. 92ECh. 14.3 - Prob. 93ECh. 14.3 - Prob. 94ECh. 14.3 - Prob. 95ECh. 14.3 - Prob. 96ECh. 14.3 - Prob. 97ECh. 14.3 - Applying the Concepts and Skills For Exercises...Ch. 14.3 - Prob. 99ECh. 14.3 - Prob. 100ECh. 14.3 - Prob. 101ECh. 14.3 - Prob. 102ECh. 14.3 - For Exercises 14.9814.103, a. compute SST, SSR,...Ch. 14.3 - Prob. 104ECh. 14.3 - In Exercises 14.10414.115, use the technology of...Ch. 14.3 - Prob. 106ECh. 14.3 - Prob. 107ECh. 14.3 - Prob. 108ECh. 14.3 - Prob. 109ECh. 14.3 - Prob. 110ECh. 14.3 - Prob. 111ECh. 14.3 - Prob. 112ECh. 14.3 - Prob. 113ECh. 14.3 - In Exercises 14.10414.115, use the technology of...Ch. 14.3 - In Exercises 14.10414.115, use the technology of...Ch. 14.3 - What can you say about SSE, SSR, and the utility...Ch. 14.3 - As we noted, because of the regression identity,...Ch. 14.4 - What is one purpose of the linear correlation...Ch. 14.4 - Prob. 119ECh. 14.4 - The symbol that is used for the linear correlation...Ch. 14.4 - A value of r close to 1 indicates that there is a...Ch. 14.4 - A value of r close to ____ indicates that there is...Ch. 14.4 - A value of r close to ____ indicates that the...Ch. 14.4 - A value of r close to 0 indicates that the...Ch. 14.4 - If y tends to increase linearly as x increases,...Ch. 14.4 - If y lends to decrease linearly as x increases,...Ch. 14.4 - If there is no linear relationship between x and...Ch. 14.4 - In each of Exercises 14.12814.130, determine...Ch. 14.4 - In each of Exercises 14.12814.130, determine...Ch. 14.4 - In each of Exercises 14.12814.130, determine...Ch. 14.4 - Answer true or false to the following statement...Ch. 14.4 - The linear correlation coefficient of a set of...Ch. 14.4 - The coefficient of determination of a set of data...Ch. 14.4 - In Exercises 14.13414.143, we repeat data from...Ch. 14.4 - In Exercises 14.13414.143, we repeat data from...Ch. 14.4 - In Exercises 14.13414.143, we repeat data front...Ch. 14.4 - Prob. 137ECh. 14.4 - In Exercises 14.13414.143, we repeat data from...Ch. 14.4 - In Exercises 14.13414.143, we repeat data from...Ch. 14.4 - In Exercises 14.13414.143, we repeat data from...Ch. 14.4 - In Exercises 14.13414.143, we repeat data from...Ch. 14.4 - In Exercises 14.13414.143, we repeat data from...Ch. 14.4 - In Exercises 14.13414.143, we repeat data from...Ch. 14.4 - In Exercises 14.14414.149, we repeat data from...Ch. 14.4 - In Exercises 14.14414.149, we repeat data from...Ch. 14.4 - In Exercises 14.14414.149, we repeat data from...Ch. 14.4 - Prob. 147ECh. 14.4 - In Exercises 14.14414.149, we repeat data from...Ch. 14.4 - In Exercises 14.14414.149, we repeat data from...Ch. 14.4 - Height and Score. A random sample of 10 students...Ch. 14.4 - Prob. 151ECh. 14.4 - Prob. 152ECh. 14.4 - Prob. 153ECh. 14.4 - Prob. 154ECh. 14.4 - In Exercise 14.154-14.166, use the technology of...Ch. 14.4 - Prob. 156ECh. 14.4 - Prob. 157ECh. 14.4 - Prob. 158ECh. 14.4 - Prob. 159ECh. 14.4 - Prob. 160ECh. 14.4 - Prob. 161ECh. 14.4 - In Exercises 14.154-14.166, use the technology of...Ch. 14.4 - In Exercises 14.15414.166, use the technology of...Ch. 14.4 - Prob. 164ECh. 14.4 - Prob. 165ECh. 14.4 - In Exercises 14.154-14.166, use the technology of...Ch. 14.4 - The coefficient of determination of a set of data...Ch. 14.4 - Country Music Blues. A Knight-Ridder News Service...Ch. 14.4 - Prob. 169ECh. 14.4 - In each of Exercises 14.169 and 14.170, a....Ch. 14 - For a linear equation y = b0 + b1x, identify the ...Ch. 14 - Consider the linear equation y = 4-3x. a. At what...Ch. 14 - In Problems 35, answer true or false to each...Ch. 14 - In Problems 35, answer true or false to each...Ch. 14 - In Problems 35, answer true or false to each...Ch. 14 - Prob. 6RPCh. 14 - In Problems 35, answer true or false to each...Ch. 14 - Prob. 8RPCh. 14 - In each of Problems 911, fill in the blank. 9....Ch. 14 - Prob. 10RPCh. 14 - Prob. 11RPCh. 14 - Prob. 12RPCh. 14 - Prob. 13RPCh. 14 - Prob. 14RPCh. 14 - Prob. 15RPCh. 14 - Prob. 16RPCh. 14 - Prob. 17RPCh. 14 - Prob. 18RPCh. 14 - Prob. 19RPCh. 14 - Equipment Depreciation. A small company has...Ch. 14 - Graduation Rates. Graduation ratethe percentage of...Ch. 14 - Graduation Rates. Refer to Problem 21. a....Ch. 14 - Graduation Rates. Refer to Problem 21. a. Compute...Ch. 14 - Exotic Plants. In the article Effects of Human...Ch. 14 - In Problems 2527, use the technology of your...Ch. 14 - Prob. 26RPCh. 14 - Prob. 27RPCh. 14 - Recall from Chapter 1 (see page 34) that the Focus...Ch. 14 - At the beginning of this chapter, we presented...
Knowledge Booster


Learn more about
Need a deep-dive on the concept behind this application? Look no further. Learn more about this topic, statistics and related others by exploring similar questions and additional content below.Similar questions
- A relationship expert wants to know if people with higher levels of emotional intelligence (measured on an interval scale from 1–6, with higher numbers meaning more intelligence) will be better liked upon first meeting people (measured on a 1–5 interval scale, with higher numbers meaning more likable). X: Emotional Intelligence Score X: First Impression Rating 6 1 2.5 4 M=3.38 s=2.14 SS = 13.69 Y: First Impression Rating 5 1.5 3 3.5 M=3.25 s=1.44 SS = 6.25 a) Create a scatterplot of the data. b) Calculate r and r2 . c) Report results in APA style. d) What do the results mean?arrow_forwardA researcher is conducting a study to examine the relationship between age and agility. She recruited a sample of 50 participants, ranging in age from 20 – 65 years old, and asked them to perform a series of agility tests. Afterward, participants were given an average agility score, which was then used in a correlation analysis against participant age. The results of the study are as follows [r(50) = -0.97, p < 0.001]. Identify the correct interpretation below. A. There is a non-significant, weak, negative correlation between age and agility, suggest that as age increases, agility decreases B. There is a statistically significant, strong, negative correlation between age and agility, suggesting that as age increases, agility decreases C. There is a non-significant, moderate, positive correlation between age and agility, suggesting that there is no relationship between these two variables D. There is a statistically significant, strong positive correlation between age and…arrow_forwardA flight travels daily from Pittsburgh to San Antonio. The following list gives the arrival time relative to the scheduled arrival time (in minutes) for a selection of 17 days. (A negative number means that the flight arrived early.) −8, −4, −4, −3, −2, 1, 2, 3, 5, 7, 8, 8, 14, 18, 24, 28, 37 Send data to calculator Frequency 8. 6. 4 2. 5 -10 7 Answer the questions below. 2 0 10 20 30 Arrival time relative to 5:07 (in minutes) 2 (a) For these data, which measures of central tendency take more than one value? Choose all that apply. 1 Mean Median O Mode 40 None of these measuresarrow_forward
- FOR EACH FXERCISE . A study was conducted to determine the relationship between a person's monthly income in dollars and the number of meals that person eats away from per month. The data from the sample are shown here. (The information in this exercise will be used for Exercises 14 and 36 in Section 10-4 and Exercise 16 in Section 10-5.) SKETCH SCAITERPLOT home - FIND SUMMARY STATISTICS FIND CORRELATION Income x 500 1200 1500 945 850 400 540 Meals y 8. 12 16 10 3arrow_forwardThe body mass index (BMI) of a person is the person’s weight divided by the square of his or her height. It is an indirect measure of the person’s body fat and an indicator of obesity. Results from surveys conducted by the Centers for Disease Control and Prevention (CDC) showed that the estimated mean BMI for US adults increased from 25.0 in the 1960–1962 period to 28.1 in the 1999–2002 period. [Source: Ogden, C., et al. (2004). Mean body weight, height, and body mass index, United States 1960–2002. Suppose you are a health researcher. You conduct a hypothesis test to determine whether the mean BMI of US adults in the current year is greater than the mean BMI of US adults in 2000. Assume that the mean BMI of US adults in 2000 was 28.1 (the population mean). You obtain a sample of BMI measurements of 1,034 US adults, which yields a sample mean of M = 28.9. Let μ denote the mean BMI of US adults in the current year. Please Formulate the null and alternative hypothesesarrow_forward2.) Explain why the relative frequency column of a frequency table might not sum to 1.0.arrow_forward
- a. Which data set has a larger variation? (justify your answer)b. Is Chebyshev' rule verified for these two data sets. (Justify your answer graphically).c. What can we conclude?arrow_forwardPlease answer 5.3 a-e. Thank you!arrow_forwardA study was done to look at the relationship between number of movies people watch at the theater each year and the number of books that they read each year. The results of the survey are shown below. Movies 10 7 6 10 0 9 1 6 Books 0 0 -0 0 9 0 9 -0 Use the model to predict the number of books read per year for someone who watches 3 movies per year.Books per year = (Please round your answer to the nearest whole number.) Interpret the slope of the regression line in the context of the question: The slope has no practical meaning since people cannot read a negative number of books. As x goes up, y goes down. For every additional movie that people watch each year, there tends to be an average decrease of 0.98 books read. Interpret the y-intercept in the context of the question: The y-intercept has no practical meaning for this study. If someone watches 0 movies per year, then that person will read 8 books this year. The best prediction for a person who doesn't watch…arrow_forward
- Paint lifetime: A paint company collected data on the lifetime (in years) of its paint in eleven United States cities. The data are in the following table. Average annual Precipitation (inches) 48.6 43.8 29.3 26.4 City Atlanta, GA Boston, MA Kansas City, KS Minneapolis, MN Dallas, TX Denver, CO Miami, FL Phoenix, AZ San Francisco, CA Seattle, WA Send data to Excel Paint Lifetime Part 1 of 2 11.5 11.7 12.3 10.5 11.2 15.2 8.7 11.1 16.7 Average January Temperature 41.9 29.6 28.4 11.2 45.0 29.5 67.1 52.3 48.5 40.6 Average July Temperature 78.6 73.5 80.9 73.1 86,3 73.3 82.4 92.3 62.2 65.3 34.2 15.3 57.5 7.1 19.7 38.9 In Cheyenne, Wyoming, the average January temperature is 26.1, the average July temperature is 68.9, and the average annual precipitation is 13.3. Construct a 95% confidence interval for the paint lifetime. Round your answers to at least two decimal places.arrow_forwardThe authors of a paper were interested in how the distance a deer mouse will travel for food is related to the distance from the food to the nearest pile of debris. Distances were measured in meters. The data and computer output are given below. Distance from Debris Distance Traveled 6.94 0.00 5.23 6.13 5.21 11.29 7.10 14.35 8.16 12.03 5.50 22.72 9.19 20.11 9.05 26.16 9.36 30.65 Simple Linear Regression Results: Dependent Variable: Traveled Independent Variable: Debris Sample size: 9 R (correlation coefficient) = 0.5657 R-sq = 0.32002088 Estimate of error standard deviation 8.670711 Parameter estimates: Parameter Estimate Std. Err. Alternative DF T-Stat P-Value Intercept -7.6854587 13.332196 ≠ 0 7 -0.5764586 0.5824 Slope 3.2340908 1.7818117 ≠ 0 7 1.8150575 0.1124 a)What is the least squares regression line for the output given above? b) what is the predicted traveled distance given the distance from debris is 6.5 meters?arrow_forwardSuppose that 95% of the bags of certain fertilizer mix weigh between 49 and 53 pounds. Averages of three succesive bags were plotted, and 47.5% of these were observed to lie between 51 and X pounds. Estimate the value of X. State assumptions you make and say whether these assumptions are likely to be true for this example.arrow_forward
arrow_back_ios
SEE MORE QUESTIONS
arrow_forward_ios
Recommended textbooks for you
 Big Ideas Math A Bridge To Success Algebra 1: Stu...AlgebraISBN:9781680331141Author:HOUGHTON MIFFLIN HARCOURTPublisher:Houghton Mifflin Harcourt
 Glencoe Algebra 1, Student Edition, 9780079039897...AlgebraISBN:9780079039897Author:CarterPublisher:McGraw Hill
Big Ideas Math A Bridge To Success Algebra 1: Stu...
Algebra
ISBN:9781680331141
Author:HOUGHTON MIFFLIN HARCOURT
Publisher:Houghton Mifflin Harcourt
Glencoe Algebra 1, Student Edition, 9780079039897...
Algebra
ISBN:9780079039897
Author:Carter
Publisher:McGraw Hill
Correlation Vs Regression: Difference Between them with definition & Comparison Chart; Author: Key Differences;https://www.youtube.com/watch?v=Ou2QGSJVd0U;License: Standard YouTube License, CC-BY
Correlation and Regression: Concepts with Illustrative examples; Author: LEARN & APPLY : Lean and Six Sigma;https://www.youtube.com/watch?v=xTpHD5WLuoA;License: Standard YouTube License, CC-BY