
Concept explainers
Videos
a.
To provide: The null and alternate hypothesis for ANOVA.
a.
Answer to Problem 1PP
The hypotheses are:
Null Hypothesis: There is no significant difference in the difference between the amount of nectar consumed from caffeine feeders and that removed from control feeders at different concentrations of caffeine.
Alternate Hypothesis: There is at least one concentration group which is significantly different from in the difference between the amount of nectar consumed from caffeine feeders and that removed from control feeders at different concentrations of caffeine.
Explanation of Solution
Given:
The data of four different concentrations of caffeine with difference between the amount of nectar consumed from caffeine feeders and that are removed from control feeders as shown below
| 50 ppm caffeine | 100 ppm caffeine | 150 ppm caffeine | 200 ppm caffeine |
| -0.4 | 0.01 | 0.65 | 0.24 |
| 0.34 | -0.39 | 0.53 | 0.44 |
| 0.19 | -0.08 | 0.39 | 0.13 |
| 0.05 | -0.09 | -0.15 | 1.03 |
| -0.14 | -0.31 | 0.46 | 0.05 |
Calculation:
The objective of the ANOVA is to check if there is any significant difference in the difference between the amount of nectar consumed from caffeine feeders and that removed from control feeders at different concentrations of caffeine.
Null Hypothesis: There is no significant difference in the difference between the amount of nectar consumed from caffeine feeders and that removed from control feeders at different concentrations of caffeine.
Alternate Hypothesis: There is at least one concentration group which is significantly different from in the difference between the amount of nectar consumed from caffeine feeders and that removed from control feeders at different concentrations of caffeine.
b.
To Calculate: The summary statistics for each group.
b.
Answer to Problem 1PP
The summary statistics of each group are shown below
Explanation of Solution
Calculation:
In excel enter the data of four different concentrations of caffeine with difference between the amount of nectar consumed from caffeine feeders and that are removed from control feeders. Click on Data → Data Analysis → ANOVA Single factor and enter the data we get the following summary statistics for each concentration.
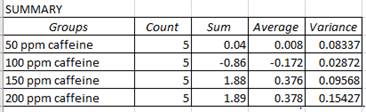
The standard deviation for given variance is calculated as shown below
c.
To calculate: The ANOVA table
c.
Explanation of Solution
Calculation:
In excel enter the data of four different concentrations of caffeine with difference between the amount of nectar consumed from caffeine feeders and that are removed from control feeders. Click on Data → Data Analysis → ANOVA Single factor and enter the data.
The obtained output is 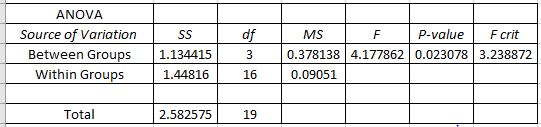
d.
To calculate: The Mean Square error in ANOVA.
d.
Answer to Problem 1PP
The Mean square error
Explanation of Solution
Calculation:
With reference to ANOVA table the mean square error is the Mean square within groups
e.
To calculate: The degree of freedom with respect to error or within groups.
e.
Answer to Problem 1PP
The degree of freedom with respect to within groups is 16.
Explanation of Solution
Calculation:
The degree of freedom for within groups with respect to the ANOVA table
f.
To Calculate: The grand mean of given data.
f.
Answer to Problem 1PP
The grand mean of given data is 0.1475.
Explanation of Solution
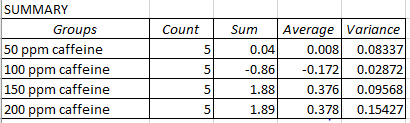
The summary statistics of given data from ANOVA output is shown below
Calculation:
With respect to summary statistics of given data the grand mean is calculated as shown below
g.
To Calculate: The group sum of squares
g.
Answer to Problem 1PP
The group sum of squares is 1.331415
Explanation of Solution
Calculation:
With respect to the ANOVA table the sum of squares for between the groups is
h.
To calculate: The group degree of freedom and group mean square.
h.
Answer to Problem 1PP
The degree of freedom for group is 3 and the group mean square is 0.378138.
Explanation of Solution
Calculation:
With respect to the ANOVA table, the group degree of freedom is 3.
The mean square for group is
i.
To calculate: The test statistic F.
i.
Answer to Problem 1PP
The test statistic F is 3.238872
Explanation of Solution
Calculation:
With respect to ANOVA table the test statistic F is 3.238872.
j.
To calculate: The p value with respect to test statistic F and degree of freedom.
j.
Answer to Problem 1PP
The p value with respect to test statistic F and degree of freedom is 0.023078.
Explanation of Solution
Calculation:
The p value with respect to test statistic F 3.238872 and degree of freedom 3, 16 is 0.023078.
Want to see more full solutions like this?
Chapter 15 Solutions
The Analysis of Biological Data


 Big Ideas Math A Bridge To Success Algebra 1: Stu...AlgebraISBN:9781680331141Author:HOUGHTON MIFFLIN HARCOURTPublisher:Houghton Mifflin Harcourt
 Glencoe Algebra 1, Student Edition, 9780079039897...AlgebraISBN:9780079039897Author:CarterPublisher:McGraw Hill
 Holt Mcdougal Larson Pre-algebra: Student Edition...AlgebraISBN:9780547587776Author:HOLT MCDOUGALPublisher:HOLT MCDOUGAL