
Concept explainers
Videos
(a)
To find: The equation for the weight of the rat after x weeks with its birth weight of 110 g.
(a)
Answer to Problem 24E
Solution: The required equation is
Explanation of Solution
Calculation:
The regression equation is the statistical method that models the data to predict a response variable from the explanatory variables. The equation of the regression line is of the form
The number b is the slope of the regression line that indicates the amount by which the response variable changes when the explanatory variable increases by one unit.
Hence, in the provided problem, 39 g is the slope since this is the amount by which the weight of the rat increases per week. The constant a is the birth weight which is 110 g. Therefore, the equation is obtained as follows:
Therefore, this is the required equation for the rat’s weight after x weeks.
To find: The slope of the obtained equation.
Solution: The slope of the obtained equation is 39.
Explanation:
Calculation:
The equation of the regression line for the rat’s weight after x weeks is obtained as
This shows that the slope of the line is 39 since this the quantity by which the weight of the rat increases per week.
Therefore, the slope of the line is 39.
Interpretation: The slope of the regression equation is 39, which indicates that with a unit change in the week the weight increases by 39 units.
(b)
To graph: The regression line for the obtained equation from the birth to 10 weeks of age.
(b)
Explanation of Solution
Calculation:
The equation for the weight of the rat after x weeks with its birth weight of 110 g is obtained as
Choose two values of x as 0 and 10 for the birth and 10 weeks, respectively. To draw the regression line, use the provided equation to predict the weight y for the number of weeks as 0 as follows:
The predicted weight y for the number of weeks as 10 is calculated as follows:
Therefore, the points are
Graph: The steps followed to obtain the regression line are as follows:
Step 1: Open the Minitab file and enter the obtained two points in the worksheet.
Step 2: Go to Graph and then select
Step 3: Select With regression and click Ok.
Step 4: Enter “Weight” in the Y variables column and “Weeks” in the X variables column and click Ok.
The regression line appears as obtained in the Minitab file.
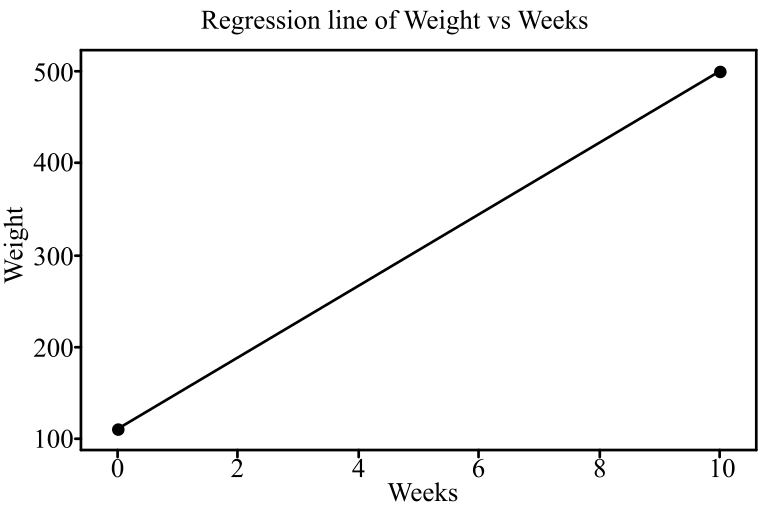
In the graph, the horizontal axis shows the weeks and the vertical axis shows the weights.
Interpretation: The graph clearly displays a positive association between the number of weeks and the weight. Thus, as the number of weeks increases the weight also increases.
(c)
Can the obtained line be willingly used to predict the rat’s weight at the age of 2 years.
(c)
Answer to Problem 24E
Solution: No, the obtained line cannot be used to predict the rat’s weight at the age of 2 years.
Explanation of Solution
To find: The weight of rat at the age of 2 years.
Solution: The predicted weight of rat at the age of 2 years is 4166 g.
Explanation:
Calculation:
The equation for the weight of the rat after x weeks with its birth weight of 110 g is obtained as
For 2 years, the number of weeks is 104. Substitute the number of weeks as 104 in the obtained equation to determine the predicted weight for 2 years of age.
Therefore, the predicted rat’s weight at the age of 2 years would be 4166 g.
To explain: If the obtained results are reasonable or not.
Solution: The predicted rat’s weight of 4166 g at 2 years is not reasonable as there is no possibility of the weight of 4166 g for a rat. The rats do not grow at a constant rate throughout their lives.
Explanation: The predicted rat’s weight for 2 years is obtained as 4166 g. The rats are very small creatures and this weight is not reasonable in real world. The rats also do not grow at the same constant rate throughout their lives.
Therefore, it can be concluded that the obtained regression line is only reliable for “young” rats.
Want to see more full solutions like this?
Chapter 15 Solutions
Statistics: Concepts and Controversies - WebAssign and eBook Access


 MATLAB: An Introduction with ApplicationsStatisticsISBN:9781119256830Author:Amos GilatPublisher:John Wiley & Sons Inc
 Probability and Statistics for Engineering and th...StatisticsISBN:9781305251809Author:Jay L. DevorePublisher:Cengage Learning
 Statistics for The Behavioral Sciences (MindTap C...StatisticsISBN:9781305504912Author:Frederick J Gravetter, Larry B. WallnauPublisher:Cengage Learning
 Elementary Statistics: Picturing the World (7th E...StatisticsISBN:9780134683416Author:Ron Larson, Betsy FarberPublisher:PEARSON
 The Basic Practice of StatisticsStatisticsISBN:9781319042578Author:David S. Moore, William I. Notz, Michael A. FlignerPublisher:W. H. Freeman
 Introduction to the Practice of StatisticsStatisticsISBN:9781319013387Author:David S. Moore, George P. McCabe, Bruce A. CraigPublisher:W. H. Freeman