
Concept explainers
Videos
1.
Find the value of point-biserial
1.
Answer to Problem 29CAP
The value of point-biserial
Explanation of Solution
Calculation:
The given information is that, the researcher is interested to measure the relation between the factors extracurricular activity and college freshman GPA.
Point-biserial correlation coefficient:
When the one factor is continuous that is measured on either interval scale or ratio scale and other is dichotomous that is measured on nominal scale, then the strength and direction of the linear relationship between the two factors can be measured by Point-biserial correlation coefficient. It is denoted by
In the formula, p and q are the proportion of scores for the dichotomous factor at each level,
The Point-biserial correlation for extracurricular activity and college freshman GPA is to be calculated. The factor ‘extracurricular activity’ has to be coded with 1 and 2. Code the value 1 for ‘No’ and 2 for ‘Yes’ for dichotomous factor ‘extracurricular activity’.
The coded data is,
|
Extracurricular activity |
College Freshman GPA |
| 2 | 3.52 |
| 2 | 3.33 |
| 2 | 3.91 |
| 2 | 3.70 |
| 1 | 2.96 |
| 1 | 3.84 |
| 1 | 3.42 |
| 1 | 2.76 |
| 1 | 3.88 |
| 1 | 2.80 |
Software procedure:
Step by step procedure to obtain test statistic value for extracurricular activity and college freshman GPA using SPSS software is given as,
- Choose Variable view.
- Under the name, enter the name as Activity, GPA.
- Choose Data view, enter the data.
- Choose Analyze>Correlate>Bivariate.
- In variables, enter the Activity, and GPA.
- Click OK.
Output using SPSS software is given below:
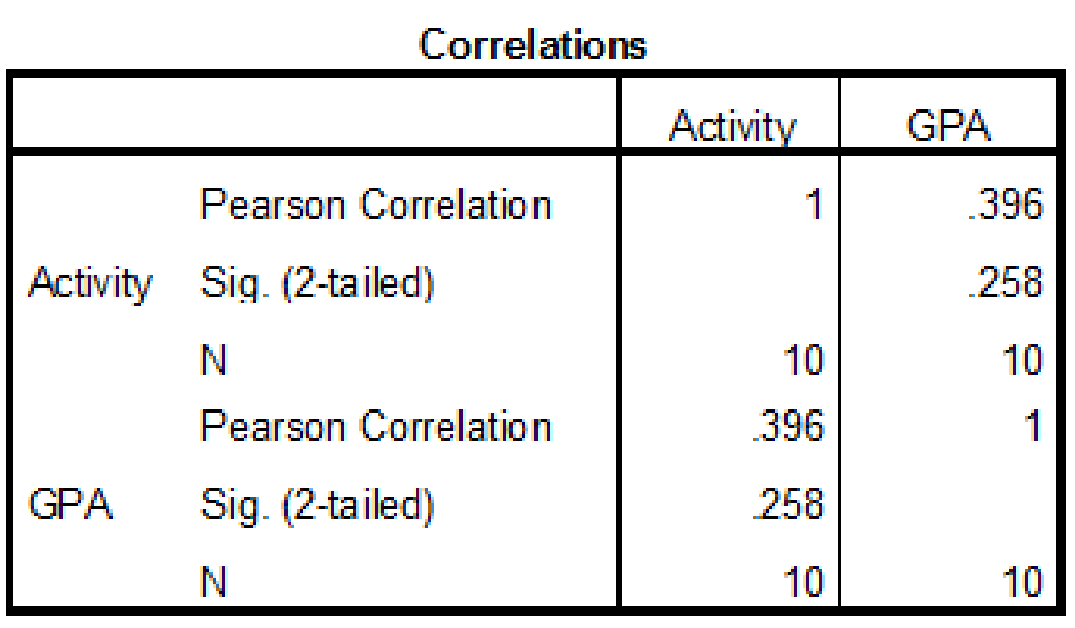
The correlation coefficient value is 0.396.
2.
Determine the decision for the null hypothesis using two-tailed test at a 0.05 level of significance
2.
Answer to Problem 29CAP
The decision is to retain the null hypothesis.
The point-biserial correlation coefficient between extracurricular activity and college freshman GPA is significant.
Explanation of Solution
Calculation:
The given information is that, correlation coefficient value is 0.396 and degrees of freedom are 8. The correlation between extracurricular activity and college freshman GPA is to be tested.
Test statistic:
The coefficient of determination for the point-serial correlation and the effect size of the two-independent-sample t test are similar and hence for significance test of point-biserial correlation, t test is used.
The formula for converting the r to a t statistic is,
In the formula, r denotes the correlation coefficient and df is the degrees of freedom for correlation coefficient.
Degrees of freedom:
The formula is.
In formula, n denotes the sample size.
Decision rules:
- If the test statistic value is greater than the critical value, then reject the null hypothesis and test is significant, or else retain the null hypothesis.
- If the negative test statistic value is less than negative critical value, then reject the null hypothesis and test is significant, or else retain the null hypothesis.
Let
Null hypothesis:
That is, the point-biserial correlation coefficient between extracurricular activity and college freshman GPA is not significant.
Alternative hypothesis:
That is, the point-biserial correlation coefficient between extracurricular activity and college freshman GPA is significant.
Degrees of freedom:
A sample of 10 participants is taken. The degrees of freedom are,
Test statistic:
Substitute,
The value of t is,
Critical value:
The given significance level is
The test is two tailed, the degrees of freedom are 8, and the alpha level is 0.05.
From the Appendix B: Table B.2 the t Distribution:
- Locate the value 8 in the degrees of freedom (df) column.
- Locate the 0.05 in the proportion in two tails combined row.
- The intersecting value that corresponds to the 8 with level of significance 0.05 is 2.306.
Thus, the critical value for
Conclusion:
The value of test statistic is 1.219.
The critical value is 2.306.
The test statistic value is greater than the critical value.
The test statistic value falls under critical region
Hence the null hypothesis is rejected and test is significant.
Thepoint-biserial correlation coefficient between extracurricular activity and college freshman GPA is not significant.
Want to see more full solutions like this?
Chapter 15 Solutions
Statistics for the Behavioral Sciences


 MATLAB: An Introduction with ApplicationsStatisticsISBN:9781119256830Author:Amos GilatPublisher:John Wiley & Sons Inc
 Probability and Statistics for Engineering and th...StatisticsISBN:9781305251809Author:Jay L. DevorePublisher:Cengage Learning
 Statistics for The Behavioral Sciences (MindTap C...StatisticsISBN:9781305504912Author:Frederick J Gravetter, Larry B. WallnauPublisher:Cengage Learning
 Elementary Statistics: Picturing the World (7th E...StatisticsISBN:9780134683416Author:Ron Larson, Betsy FarberPublisher:PEARSON
 The Basic Practice of StatisticsStatisticsISBN:9781319042578Author:David S. Moore, William I. Notz, Michael A. FlignerPublisher:W. H. Freeman
 Introduction to the Practice of StatisticsStatisticsISBN:9781319013387Author:David S. Moore, George P. McCabe, Bruce A. CraigPublisher:W. H. Freeman