Managerial Accounting: Creating Value in a Dynamic Business Environment
12th Edition
ISBN: 9781260417074
Author: HILTON, Ronald
Publisher: MCGRAW-HILL HIGHER EDUCATION
expand_more
expand_more
format_list_bulleted
Videos
Textbook Question
Chapter 15, Problem 31E
The marginal cost, marginal revenue, and demand
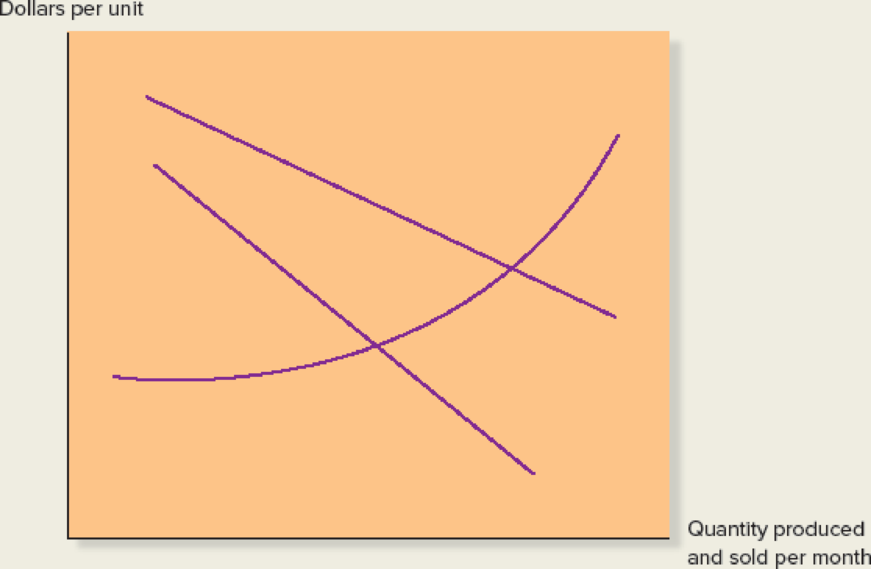
Required: Before completing any of the following requirements, read over the entire list.
- 1. Trace the graph onto a blank piece of paper, and label all parts of the graph.
- 2. Draw a companion graph directly above the traced graph. Use this graph to draw the firm’s total revenue and total cost curves.
- 3. Show the company’s profit-maximizing price on the lower graph and its profit-maximizing quantity on both graphs.
Expert Solution & Answer
Want to see the full answer?
Check out a sample textbook solution
Students have asked these similar questions
On the Data Tables - Student tab in your Excel spreadsheet, update the given information section of the Income
Statement for Hello Company with the data below:
Units
Price per unit
Variable expense per unit
Total Fixed Costs
Income Statement
SCENARIO 1
Product A
Product B
Product C
Required:
2. Using the Data Table What-if Analysis tool in Excel, determine the Units and Operating Income (Loss) for each
product based on the following scenarios. (Hint: Don't forget that the warehouse can only hold up to 45,000 units.)
Scenario 1: Pete wants to find the mix of units that will result in the highest overall Operating Income, perform this
analysis using a two variable data table. Product A can vary between 32,000 units and a maximum of 37.000 units.
Product B can vary between 5,000 units and a maximum of 10,000 units. Both Products A and B are manufactured
in 1,000-unit increments. The production level of Product C is the same each month at 3,000 units.
SCENARIO 2
Product A
Product B
Product…
UPVOTE WILL BE GIVEN! INPUT THE COMPLETE SOLUTIONS. YOU MAY USE EXCEL. BOX THE FINAL ANSWERS.
c. Calculate for the total manufacturing cost per unit?
d. How much is the total cost for Started and Completed?
Convert the accompanying database to an Excel table to find:
a.The total cost of all orders.
b. The total quantity of airframe fasteners purchased.
c. The total cost of all orders placed with Manley Valve.
Chapter 15 Solutions
Managerial Accounting: Creating Value in a Dynamic Business Environment
Ch. 15 - Prob. 1RQCh. 15 - Prob. 2RQCh. 15 - List and briefly describe four major influences on...Ch. 15 - Prob. 4RQCh. 15 - Prob. 5RQCh. 15 - Prob. 6RQCh. 15 - Define the following terms: total revenue,...Ch. 15 - Prob. 8RQCh. 15 - Prob. 9RQCh. 15 - Prob. 10RQ
Ch. 15 - Prob. 11RQCh. 15 - List the four common cost bases used in cost-plus...Ch. 15 - List four reasons often cited for the widespread...Ch. 15 - What is the primary disadvantage of basing the...Ch. 15 - Prob. 15RQCh. 15 - Prob. 16RQCh. 15 - Prob. 17RQCh. 15 - Explain the phrase price-led costing.Ch. 15 - Prob. 19RQCh. 15 - Prob. 20RQCh. 15 - Could tear-down methods be used effectively for...Ch. 15 - Briefly describe the time-and-material pricing...Ch. 15 - Explain the importance of the excess-capacity...Ch. 15 - Prob. 24RQCh. 15 - Describe the following approaches to pricing new...Ch. 15 - Prob. 26RQCh. 15 - Briefly explain the potential negative...Ch. 15 - Prob. 28ECh. 15 - Prob. 29ECh. 15 - Prob. 30ECh. 15 - The marginal cost, marginal revenue, and demand...Ch. 15 - Prob. 32ECh. 15 - Refer to the cost and production data for the Wave...Ch. 15 - Prob. 35ECh. 15 - The following data pertain to Royal Lighting...Ch. 15 - Prob. 37ECh. 15 - Badger Valve and Fitting Company, located in...Ch. 15 - North American Pharmaceuticals, Inc. specializes...Ch. 15 - MPE, Inc. will soon enter a very competitive...Ch. 15 - Prob. 41PCh. 15 - Prob. 42PCh. 15 - Prob. 43PCh. 15 - Alexis Kunselman, president of Pharsalia...Ch. 15 - Southern Tier Heating, Inc. installs heating...Ch. 15 - Omaha Synthetic Fibers Inc. specializes in the...Ch. 15 - Prob. 47PCh. 15 - Prob. 48CCh. 15 - Zylar Industries is a manufacturer of standard and...
Knowledge Booster


Learn more about
Need a deep-dive on the concept behind this application? Look no further. Learn more about this topic, accounting and related others by exploring similar questions and additional content below.Similar questions
- Convert the accompanying database to an excel table to find: a. The total cost of all orders b. The total quantity of airframe fasteners purchased. c. The total cost of all orders placed with Manley Valve.arrow_forwardMatch each of the following cost items with the value chain business function where you would expect the cost to be incurred: Cost Item 1. Labor time to repair products under warranty 2. Radio commercials 3. Labor costs of delivering customer orders 4. Testing of competitor's product 5. Direct manufacturing labor costs 6. Development of order tracking system for online sales 7. Design cost of new product brochures 8. Hours spent designing childproof bottles 9. Training costs for representatives to staff the customer call center 10. Installation of robotics equipment in manufacturing plant Business Functionarrow_forwardThe graphs below represent cost behavior patterns that might occur in acompany's cost structure. The vertical axis represents total cost, and thehorizontal axis represents activity output. Required:For each of the following situations, choose the graph from the group a-1 that best illustrates the cost pattern involved. Also, for each situation,identify the driver that measures activity output. 1. The cost of power when a fixed fee of $500 per month is chargedplus an additional charge of $0.12 per kilowatt-hour used2. Commissions paid to sales representatives. Commissions arepaid at the rate of 5 percent of sales made up to total annual salesof $500,000, and 7 percent of sales above $500,000.3. A part purchased from an outside supplier costs $12 per part for the first 3,000 parts and $10 per part for all parts purchased inexcess of 3,000 units.4. The cost of surgical gloves, which are purchased in incrementsof 100 units (gloves come in boxes of 100 pairs).5. The cost of tuition at a…arrow_forward
- The graphs below represent cost behavior patterns that might occur in a company’s cost structure. The vertical axis represents total cost, and the horizontal axis represents activity output Required:For each of the following situations, choose the graph from the group a–1 that best illustrates the cost pattern involved. Also, for each situation, identify the driver that measures activity output.1. The cost of power when a fixed fee of $500 per month is charged plus an additional charge of $0.12 per kilowatt-hour used.2. Commissions paid to sales representatives. Commissions are paid at the rate of 5 percent of sales made up to total annual sales of $500,000, and 7 percent of sales above $500,000.3. A part purchased from an outside supplier costs $12 per part for the first 3,000 parts and $10 per part for all parts purchased in excess of 3,000 units.4. The cost of surgical gloves, which are purchased in increments of 100 units (gloves come in boxes of 100 pairs).5. The cost of tuition…arrow_forwardquestion is in image. Required: Prepare a schedule of cost of goods manufactured. Prepare a schedule of cost of goods sold. Prepare an income statement. Build a spreadsheet: Construct an Excel spreadsheet to solve all of the preceding requirements. Show how both cost schedules and the income statement will change if the following data change: direct labor is $390,000 and utilities cost $35,000.arrow_forwardThe accompanying figures depict a number of cost behavior patterns that might be found in a company's cost structure. The vertical axis on each graph represents total cost, and the horizontal axis on each graph represents level of activity (volume). For each of the given situations, identify the graph that illustrates the cost pattern involved. Any graph may be used more than once. (Adapted originally from the CPA exam; also found in R.H. Garrison and E.W. Noreen, Managerial Acco11111ing, 9th edition, Irwin, 2009.)(a) Electricity bill-a flat-rate fixed charge plus a variable cost after a certainnumber of kilowatt-hours are used.(b) City water bill, which is computed as follows:First 1,000,000 gallons $1,000 flat, or lessNext 10,000 gallons $0.003 per gallon usedNext 10,000 gallons $0.006 per gallon usedNext 10,000 gallons $0.009 per gallon used(c) Depreciation of equipment, where the amount is computed…arrow_forward
- Using the data in P4-2 and Microsoft Excel: 1. Separate the variable and fixed elements. 2. Determine the cost to be charged to the product for the year. 3. Determine the cost to be charged to factory overhead for the year. 4. Determine the plotted data points using Chart Wizard. 5. Determine R2. 6. How do these solutions compare to the solutions in P4-2 and P4-3? 7. What does R2 tell you about this cost model?arrow_forwardThe following is a financial information from MayPagAsaPa Company: Additional information:The company purchase office supplies from big manufacturers and distributes among different segments. Cost of goods sold and shipping expenses are both variable. 1.Prepare a new contribution format segmented income statement. 2.Analyze your requirement #1. What points that might help to improve the company’s performance would you bring to management’s attention? 3.Compare your output with Requirement 1 with the information above. List the items you think that is an error/disadvantage/weakness of the given data.arrow_forwardClassifying Costs as Product or Period Costs Suppose that you have been given a summer job as an intern at Issac Aircams, a company that manufactures sophisticated spy cameras for remote-controlled military reconnaissance aircraft. The company, which is privately owned, has approached a bank for a loan to help finance its growth. The bank requires financial statements before approving the loan. Required: Classify each cost listed below as either a product cost or a period cost for the purpose of preparing financial statements for the bank. 1. Depreciation on salespersons’ cars. 2. Rent on equipment used in the factory. 3. Lubricants used for machine maintenance. 4. Salaries of personnel who work in the finished goods warehouse. 5. Soap and paper towels used by factory workers at the end of a shift. 6. Factory supervisors’ salaries. 7. Heat, water, and power consumed in the factory. 8. Materials used for boxing products for shipment overseas. (Units are not normally boxed.) 9.…arrow_forward
- 1. You have been provided with the following data regarding shipments and costs for Brighton Boutiques: Number of Shipments Received Cost per Receiving Report $202 185 120 105 70 80 87 115 100 $300 $200 $100 $- 0 142 154 20 162 Required: Plot the data points on a scatter graph, and then using the high-low method, determine the cost function of the line that will connect the high and low points on the graph. Does the cost function appear to be linear in nature? 200 175 Graph Template 40 80 60 Number of Shipments 100 120 140arrow_forwardRetail companies with today’s online, as well as in-store sales have a lot of data to keep track of! Keeping track of sales, costs, and profits daily is essential to making the most of a business. This exercise illustrates how to use the skills presented in this Module to generate the data needed daily by a retail company. Create the following calculated columns. a) In I4, and J4, use a VLOOKUP function that will look up the Product Price and Product Cost based on the Product Sold column which lists an ID number. [Hint: The Product Table sheet lists the Price and Cost] If any error messages appear, check the Range Lookup. b) In K4, use a formula to calculate Profit. Hint: Profit =(Product Price-Product Cost)*Units Sold Format columns I, J, and K as currency with two decimal places. Make a copy of the Sales sheet and rename it Online Sales by Date. Place this sheet to the right of the Sales sheet. Answer the following question by filtering the data accordingly. a) What was the…arrow_forwardWhat I Know Before we begin this lesson, let us check first your prior knowledge on this module. After taking and checking this short test, take note of the items that you are not able to answer correctly and look for the right answer as you go through this module. Direction: Encircle the letter of the correct answer. 1. What type of cost includes product ingredients and materials? а. fixed b. revenue с. total d. variable 2. What type of cost includes the rental of space? а. fixed b. revenue c. total d. variable 3. What type of cost is the product of the price and the quantity sold? а. fixed b. revenue с. total d. variable 4. What concept is being described when the business will neither earn a profit nor suffer a loss? а. break-even b. loss с. profit d. summit 5. What type of analysis shows equal revenue and total cost? а. break-even b. cost of variable c. profit-loss d. volume of salesarrow_forward
arrow_back_ios
SEE MORE QUESTIONS
arrow_forward_ios
Recommended textbooks for you
 Principles of Cost AccountingAccountingISBN:9781305087408Author:Edward J. Vanderbeck, Maria R. MitchellPublisher:Cengage Learning
 Managerial AccountingAccountingISBN:9781337912020Author:Carl Warren, Ph.d. Cma William B. TaylerPublisher:South-Western College Pub
 Principles of Accounting Volume 2AccountingISBN:9781947172609Author:OpenStaxPublisher:OpenStax College
Principles of Cost Accounting
Accounting
ISBN:9781305087408
Author:Edward J. Vanderbeck, Maria R. Mitchell
Publisher:Cengage Learning
Managerial Accounting
Accounting
ISBN:9781337912020
Author:Carl Warren, Ph.d. Cma William B. Tayler
Publisher:South-Western College Pub
Principles of Accounting Volume 2
Accounting
ISBN:9781947172609
Author:OpenStax
Publisher:OpenStax College
How to Estimate Project Costs: A Method for Cost Estimation; Author: Online PM Courses - Mike Clayton;https://www.youtube.com/watch?v=YQ2Wi3Jh3X0;License: Standard Youtube License