
Concept explainers
Videos
Recall that in exercise 45 the personnel director for Electronics Associates developed the following estimated regression equation relating an employee’s score on a job satisfaction test to length of service and wage rate.
where
x1 = length of service (years)
x2 = wage rate (dollars)
y = job satisfaction test score (higher scores indicate greater job satisfaction)
A portion of the Excel Regression tool output follows.
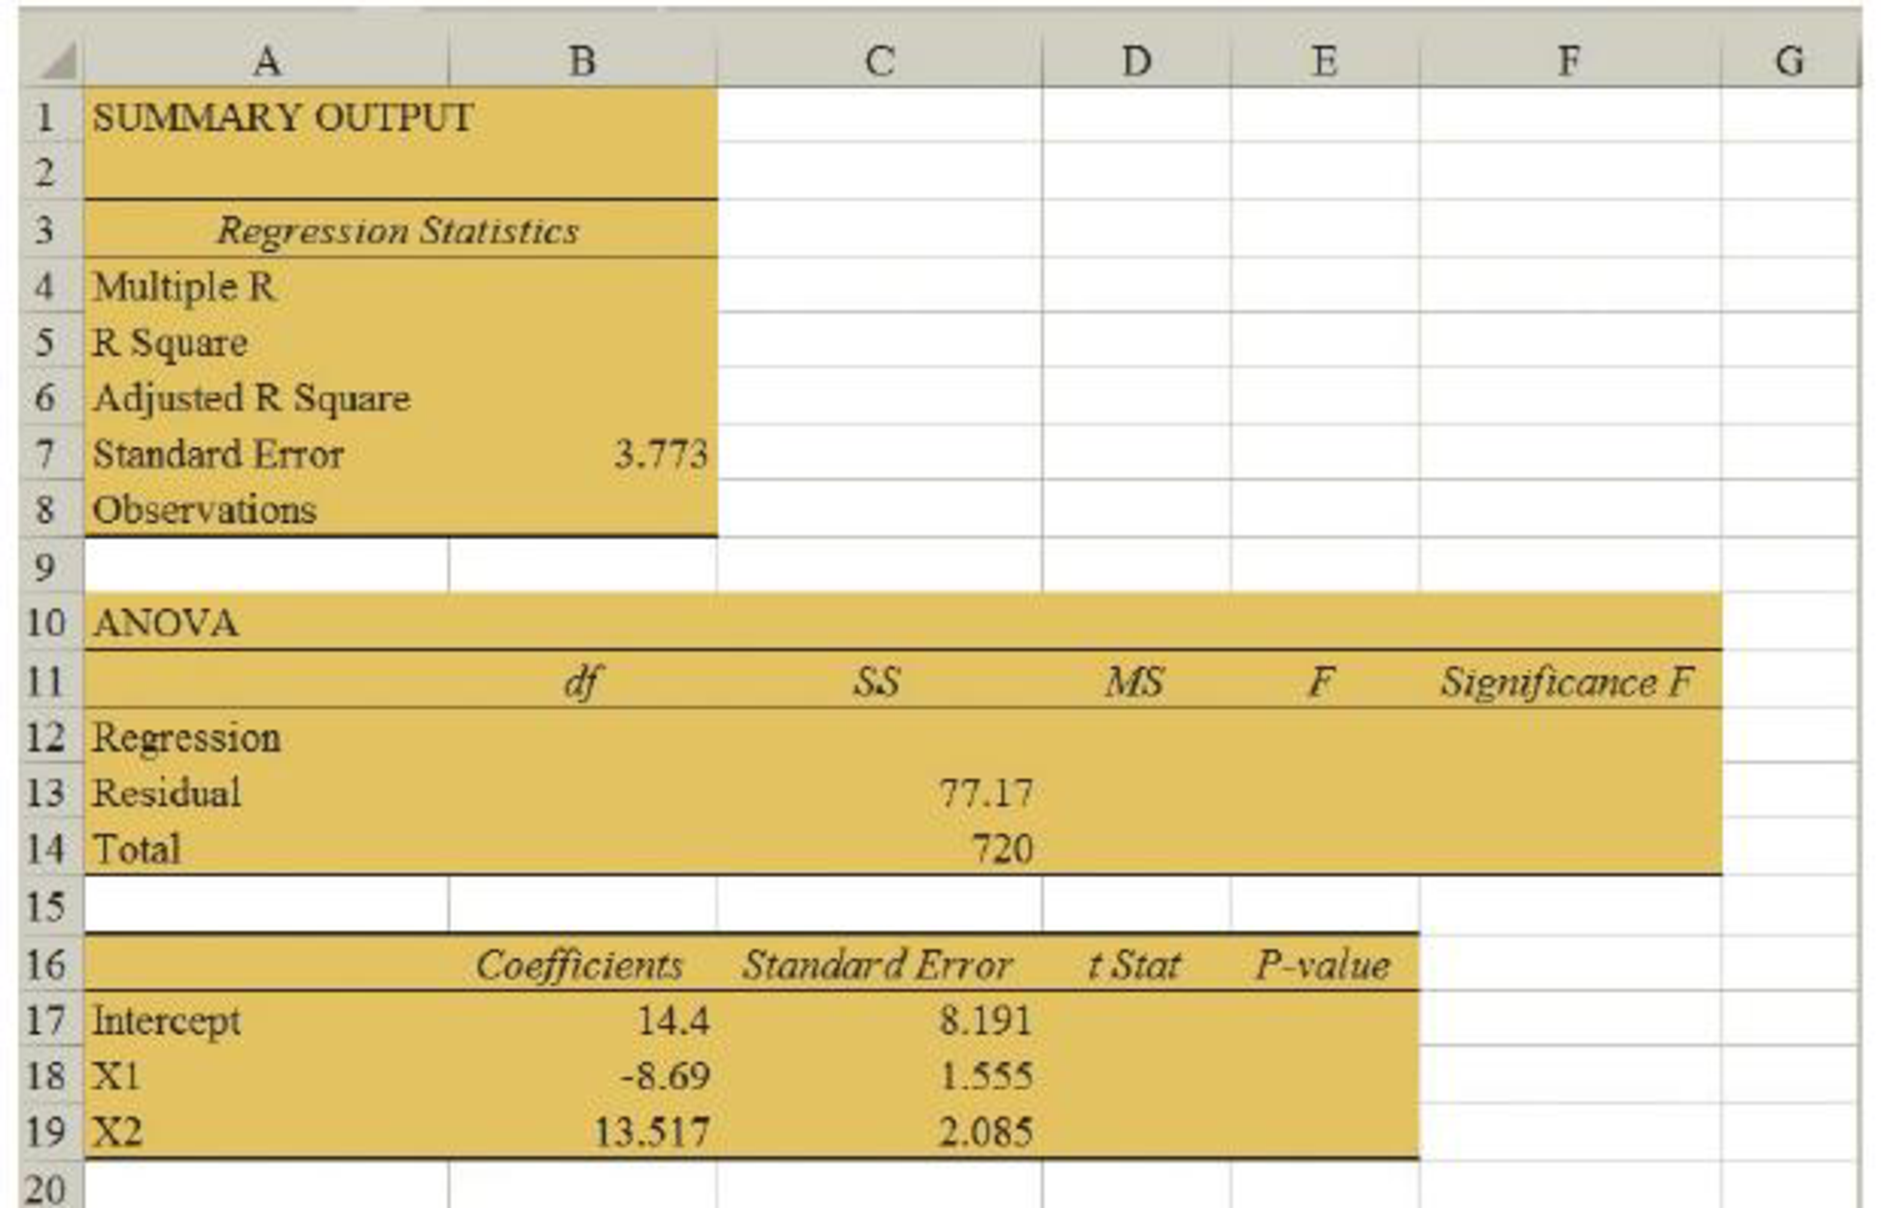
- a. Complete the missing entries in this output.
- b. Using α = .05, test for overall significance.
- c. Did the estimated regression equation provide a good fit to the data? Explain.
- d. Use the t test and α = .05 to test H0: β1 = 0 and H0: β2 = 0.
45. The personnel director for Electronics Associates developed the following estimated regression equation relating an employee’s score on a job satisfaction test to his or her length of service and wage rate.
where
x1 = length of service (years)
x2 = wage rate (dollars)
y = job satisfaction test score (higher scores indicate greater job satisfaction)
- a. Interpret the coefficients in this estimated regression equation.
- b. Predict the job satisfaction test score for an employee who has four years of service and makes $6.50 per hour.
Want to see the full answer?
Check out a sample textbook solution
Chapter 15 Solutions
Modern Business Statistics with Microsoft Excel (MindTap Course List)


- If your graphing calculator is capable of computing a least-squares sinusoidal regression model, use it to find a second model for the data. Graph this new equation along with your first model. How do they compare?arrow_forwardOlympic Pole Vault The graph in Figure 7 indicates that in recent years the winning Olympic men’s pole vault height has fallen below the value predicted by the regression line in Example 2. This might have occurred because when the pole vault was a new event there was much room for improvement in vaulters’ performances, whereas now even the best training can produce only incremental advances. Let’s see whether concentrating on more recent results gives a better predictor of future records. (a) Use the data in Table 2 (page 176) to complete the table of winning pole vault heights shown in the margin. (Note that we are using x=0 to correspond to the year 1972, where this restricted data set begins.) (b) Find the regression line for the data in part ‚(a). (c) Plot the data and the regression line on the same axes. Does the regression line seem to provide a good model for the data? (d) What does the regression line predict as the winning pole vault height for the 2012 Olympics? Compare this predicted value to the actual 2012 winning height of 5.97 m, as described on page 177. Has this new regression line provided a better prediction than the line in Example 2?arrow_forwardAt a .01 level of significance is there sufficient evidence to conclude that the number of books sold is related to the number of registered students in a straight-line manner, and give the regression equation.arrow_forward
- Develop an estimated multiple regression equation that relates risk of a stroke to a person's age, systolic blood pressure and whether the person is a smoker. x1=persons age x2systrolic blood pressure x3=whether person is a smoker or non smokerarrow_forwardA scientific foundation wanted to evaluate the relation between y= salary of researcher (in thousands of dollars), x1= number of years of experience, x2= an index of publication quality, x3=sex (M=1, F=0) and x4= an index of success in obtaining grant support. A sample of 35 randomly selected researchers was used to fit the multiple regression model. Parts of the computer output appear below. Based from the table, what is the constant term of the multiple linear regression?arrow_forward** had to resubmit this question because the first time the data was duplicated and reflected incorrectly. The table below gives the number of hours spent unsupervised each day as well as the overall grade averages for seven randomly selected middle school students. Using this data, consider the equation of the regression line, yˆ=b0+b1xy^=b0+b1x, for predicting the overall grade average for a middle school student based on the number of hours spent unsupervised each day. Keep in mind, the correlation coefficient may or may not be statistically significant for the data given. Remember, in practice, it would not be appropriate to use the regression line to make a prediction if the correlation coefficient is not statistically significant. Hours Unsupervised 1 2 3 4 5 5.5 6 Overall Grades 96 89 87 77 76 68 64 **Please circle the answer for each step so I don't get confused. Thanks in advance for helping me with the breakdown and notes** Step 1 of 6 : Find the…arrow_forward
- For the 2011 season, suppose the average number of passing yards per attempt for a certain NFL team was 6.1. Use the estimated regression equation developed in part (c) to predict the percentage of games won by that NFL team. (Note: For the 2011 season, suppose this NFL team's record was 7 wins and 9 losses. Round your answer to the nearest integer.)arrow_forwardA car dealer wants to estimate the price of a used car based on the age of the car and the mileage. Based on a sample of 20 cars, she determines the sample regression equation that predicts price taxes on the basis of the age (in years) of the number of miles is Price=21,510-1230Age-0.035 Miles (a) If the age of the car was fixed and the mileage was increased by 10,000, would the price increase or decrease and by how much? (b) Predict the selling price of a five-year-old car with 65,000 miles. (Round your answers to the nearest whole number.)arrow_forwardYou spilled water on your calculations from (a) and can't remember what your estimated regression parameters are. But you do have two possible estimated errors for each of your initial four observations:arrow_forward
- An automotive sales manager wishes to examine the relationship between age (years) and sales price ($) for used automobiles of a certain brand. The accompanying table contains data for a sample of a certain make and model that were listed for sale at a car shopping website. b. Fit a quadratic regression model to predict price and state the quadratic regression equation.arrow_forwardA social scientist collects information about counties in California and finds that the correlation between average income of the county and a rating of healthcare quality in the county is 0.78. A scatterplot of the two variables is football shaped. A particular county has an average income that is 0.4 SDs above the average of all counties. Using regression, we would predict that its healthcare quality is _________ SDs above the average healthcare quality for all counties, and that it is therefore at the _________ percentile of healthcare quality among all counties. Choose the answer below to fill in the two blanks. Group of answer choices 0.31; 24th 0.78; 58th 0.78; 79th 0.31; 62nd PreviousNextarrow_forwardcreate graph of the two-variable data with a regression line, r, r2, and separate residual plotarrow_forward
 College AlgebraAlgebraISBN:9781305115545Author:James Stewart, Lothar Redlin, Saleem WatsonPublisher:Cengage Learning
 Algebra and Trigonometry (MindTap Course List)AlgebraISBN:9781305071742Author:James Stewart, Lothar Redlin, Saleem WatsonPublisher:Cengage Learning
 Trigonometry (MindTap Course List)TrigonometryISBN:9781305652224Author:Charles P. McKeague, Mark D. TurnerPublisher:Cengage Learning