![Excursions in Modern Mathematics (8E) [Math 11008: Explorations in Modern Mathematics] (Kent State University)](https://www.bartleby.com/isbn_cover_images/9781269446716/9781269446716_largeCoverImage.gif)
Excursions in Modern Mathematics (8E) [Math 11008: Explorations in Modern Mathematics] (Kent State University)
10th Edition
ISBN: 9781269446716
Author: Peter Tannenbaum
Publisher: PEARSON
expand_more
expand_more
format_list_bulleted
Concept explainers
Videos
Textbook Question
Chapter 15, Problem 50E
Exercise 45 and 46 refer to the box plot in Fig.15-18 showing the starting salaries of Tasmania State University first year graduates in agriculture and engineering. (These are the two box plot discussed in Example 15.15.)
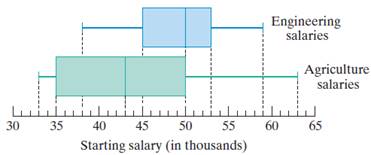
This exercise refers to the starting salaries of Tasmania State University first-year graduates in agriculture and engineering discussed in Exercises 45 and 46.
a. Estimate the range for the starting salaries of agriculture majors.
b. Estimate the interquartile range for the starting salaries of engineering majors.
Expert Solution & Answer
Want to see the full answer?
Check out a sample textbook solution
Students have asked these similar questions
The maximum discount value of the Entertainment® card for the “Fine Dining” section, Edition 10, for various pages is given below.
Page number Maximum value ($)4 1614 1925 1532 1743 1957 1572 1685 1590 17a) Decide which variable should be the independent variable and which should be the dependent variable. Justify your choice. b) Draw a scatter plot of the ordered pairs. c) Does it appear that the restaurants giving the maximum value are placed in the beginning of the “Fine Dining” section? How did you arrive at your answer? d) What is the slope of the least squares (best-fit) line? Interpret the slope. e) What is the intercept of the least squares (best-fit) line? Interpret the intercept. f) Write down the equation for the least squares line. Interpret your equation. g) Find the estimated maximum…
part e asks to choose one of the box plots
The following data give the number of defective motors received in 20 differentshipments.
8 12 10 16 10 25 21 15 17 526 21 29 8 6 21 10 17 15 13
Construct a dot plot for these data.
Chapter 15 Solutions
Excursions in Modern Mathematics (8E) [Math 11008: Explorations in Modern Mathematics] (Kent State University)
Ch. 15 - Exercises 1 through 4 refer to the data set shown...Ch. 15 - Exercises 1 through 4 refer to the data set shown...Ch. 15 - Exercises 1 through 4 refer to the data set shown...Ch. 15 - Exercises 1 through 4 refer to the data set shown...Ch. 15 - Exercises 5 through 10 refer to Table 15-13, which...Ch. 15 - Exercises 5 through 10 refer to Table 15-13, which...Ch. 15 - Exercises 5 through 10 refer to Table 15-13, which...Ch. 15 - Exercise 5 through 10 refer to Table 15-13, which...Ch. 15 - Exercise 5 through 10 refer to Table 15-13, which...Ch. 15 - Exercise 5 through 10 refer to Table 15-13, which...
Ch. 15 - Exercise 11 and 12 refer to the bar graph shown in...Ch. 15 - Exercise 11 and 12 refer to the bar graph shown in...Ch. 15 - Exercise 13 and 14 refer to the pie chart in Fig....Ch. 15 - Exercise 13 and 14 refer to the pie chart in Fig....Ch. 15 - Table 15-14 shows the class interval frequencies...Ch. 15 - Table 15-15 shows the class interval frequencies...Ch. 15 - Table 15-16 shows the percentage of U.S. working...Ch. 15 - Table 15-17 shows the percentage of U.S. workers...Ch. 15 - Exercises 19 and 20 refer to Table 15-18, which...Ch. 15 - More than Less than or equal to Number of babies...Ch. 15 - Exercises 21 and 22 refer to the two histograms...Ch. 15 - Exercises 21 and 22 refer to the two histograms...Ch. 15 - Consider the data set {3,5,7,4,8,2,8,3,6}. a.Find...Ch. 15 - Consider the data set {4,6,8,5.2,10.4,10,12.6,13}...Ch. 15 - Find the average A and median M of each of the...Ch. 15 - Find the average A and median M of each of the...Ch. 15 - Find the average A and median M of each of the...Ch. 15 - Find the average A and median M of each of the...Ch. 15 - Table 15-19 shows the results of a 5-point musical...Ch. 15 - Table 15-20 shows the ages of the firefighters in...Ch. 15 - Table 15-21 shows the relative frequencies of the...Ch. 15 - Table 15-22 shows the relative frequencies of the...Ch. 15 - Consider the data set {5,7,4,8,2,8,3,6}. a. Find...Ch. 15 - Consider the data set {4,6,8,5.2,10.4,10,12.6,13}....Ch. 15 - For each data set, find the 75th and the 90th...Ch. 15 - For each data set, find the 10th and the 25th...Ch. 15 - Table 15-20 Age 25 27 28 29 30 Frequency 2 7 6 9...Ch. 15 - This exercise refers to the math quiz scores shown...Ch. 15 - Prob. 39ECh. 15 - Exercise 39 and 40 refer to SAT test scores for...Ch. 15 - Consider the data set {5,7,4,8,2,8,3,6}. a. Find...Ch. 15 - Consider the data set {4,6,8,5.2,10.4,10,12.6,13}....Ch. 15 - Prob. 43ECh. 15 - This exercise refers to the distribution of the...Ch. 15 - Exercises 45 and 46 refer to the two box plots in...Ch. 15 - Exercises 45 and 46 refer to the two box plots in...Ch. 15 - For the data set {5,7,4,8,2,8,3,6}, find a. the...Ch. 15 - For the data set {4,6,8,5.2,10.4,10,12.6,13}, find...Ch. 15 - A realty company has sold N=341 homes in the last...Ch. 15 - Exercise 45 and 46 refer to the box plot in...Ch. 15 - Prob. 51ECh. 15 - For Exercises 51 through 54, you should use the...Ch. 15 - For Exercises 51 through 54, you should use the...Ch. 15 - For Exercises 51 through 54, you should use the...Ch. 15 - The purpose of Exercises 55 and 56 is to practice...Ch. 15 - The purpose of Exercises 55 and 56 is to practice...Ch. 15 - Exercises 57 and 58 refer to the mode of a data...Ch. 15 - Exercises 57 and 58 refer to the mode of a data...Ch. 15 - Mikes average on the first five exams in Econ 1A...Ch. 15 - Explain each of the following statements regarding...Ch. 15 - In 2006, the median SAT score was the average of...Ch. 15 - In 2004, the third quartile SAT scores was...Ch. 15 - Prob. 63ECh. 15 - Suppose that the average of 10 numbers is 7.5 and...Ch. 15 - Prob. 65ECh. 15 - What happens to the five-number summary of the...Ch. 15 - Prob. 67ECh. 15 - Prob. 68ECh. 15 - Prob. 69ECh. 15 - Prob. 70ECh. 15 - Prob. 71ECh. 15 - Prob. 72ECh. 15 - Prob. 73ECh. 15 - Suppose that the standard deviation of the data...Ch. 15 - Chebyshevs theorem. The Russian mathematician P.L....
Knowledge Booster


Learn more about
Need a deep-dive on the concept behind this application? Look no further. Learn more about this topic, subject and related others by exploring similar questions and additional content below.Similar questions
- Suppose that a customer is purchasing a car. He conducts an experiment in which he puts 10 gallons of gas in the car and drives it until it runs out of gas. He conducts this experiment 15 times on each car and records the number of miles driven. Full data set Car 1 216 243 205 242 239 297 295 172 270 251 165 310 265 316 278 Car 2 231 220 223 205 245 257 242 292 248 252 287 255 250 293 251 ..... Describe each data set, that is determine the shape, center, and spread. Sample mean for Car 1 x=__________mi / 10 gal (Type an integer or decimal rounded to one decimal place as needed.) Sample mean for Car 2 x=___________mi / 10 gal (Type an integer or decimal rounded to one decimal place as needed.) Median for Car 1 M=____________mi / 10 gal (Type an integer or decimal rounded to one decimal place as needed.) Median for Car 2 M=___________mi / 10 gal (Type…arrow_forwardA stem-and-leaf plot for the number of touchdowns scored by all Division 1A football teams is shown below. Complete parts (a) through (c). 1 3 4 5 7 8 8 Key: 1|5=15 2 0 1 2 2 3 4 5 7 8 8 9 3 0 0 1 1 1 2 2 3 3 4 4 5 5 7 7 7 8 9 4 0 0 1 2 2 3 4 5 5 5 5 6 7 8 8 9 5 0 2 3 5 5 7 8 6 1 3 6 7 7 8 7 (a) If a team is selected at random, find the probability the team scored at least 33 touchdowns.arrow_forwardAn exercise physiologist used skinfold measurements to estimate the total body fat, expressed as a percentage of body weight, for a random sample of 10 male participants in a physical fitness program. The data of body fat percentages and the body weights are shown in the table below. Participant Weight X(kg) Fat Y (%) 1 89 28 2 88 27 3 66 24 4 59 23 5 93 27 6 73 26 7 82 29 8 77 25 9 100 33 10 67 29 A. Describe the strength and direction of the linear relationship between body weight and body fat for men. B. Give the estimated regression equation. C. Give the estimated value for the slope, and accurately interpret it in a few sentences in terms of the problem: D. Using this information and the output from R, predict the body fat (%) for a male whose weight was 200 kg. E. Using this information from the R output,…arrow_forward
- The data in the given table gives the automobile fatality rates (deaths per 10,000 vehicles in use) in 2016 for the 25 states with the highest death rates. Calculate the five-number summary. Test for any potential outlier values. Create a boxplot or modified box plot for the data. State CA MN GA WA WI IN OH VA TX MA IL MD LA Rates 80 91 97 101 101 104 104 106 107 108 108 111 113 State AL MI MO NJ KY TN AZ PA FL SC NY NC Rates 114 118 119 121 124 129 131 133 133 134 143 150arrow_forwardThe data represent the heights in feet and the number of stories of the tallest buildings in a city. Height, x Stories, y 947 57 708 52 658 46 529 40 450 31 446 28 430 24 420 26 419 32 Scatter Plot for the Heights (in Feet) and Number of Stories of the Buildings. y 10 20 30 40 50 60 70 80 90 x 100 200 300 400 500 600 700 800 900 0 Part: 0 / 3 0 of 3 Parts Complete Part 1 of 3 Find the value for r . Round your answer to at least three decimal places. r ≈ 0.942 Part: 1 / 3 1 of 3 Parts Complete Part 2 of 3 Test the significance of r at the 5% level and at the 1% level. Sample Size 5% 1% Sample Size 5% 1% 4 .950 .990 17 .482 .606 5 .878 .959 18 .468 .590 6…arrow_forwardGiven the following data for 25 male students, build a modified box plot and identify the required statistics. Weight (lb): 123 134 140 148 149 150 150 150 155 158 160 160 163 170 170 175 175 175 180 185 190 195 223 231 -Identify the median for this data -identify the interquartile range -identify the value of the upper limit -identify the value of the adjacent Ppoint -is the minimum the adjacent point?arrow_forward
- 6) part 4. Generate a abo plot for the asteroid data.arrow_forwardA study on driving speed (miles per hour) and fuel efficiency (miles per gallon) for midsize automobiles resulted in the following data: Driving Speed 30 50 40 55 30 25 60 25 50 55 Fuel Efficiency 28 25 25 23 30 32 21 35 26 25 Construct a scatter diagram with driving speed on the horizontal axis and fuel efficiency on the vertical axis.arrow_forwardGiven the following data on lawnmower engine emissions and age of the lawnmower Age Emission 0 1.72 0 4.38 2 4.06 11 1.26 7 5.31 16 0.57 9 3.37 0 3.44 12 0.74 4 1.24 Construct a scatterplot of emissions versus age What are the characteristics of the scatter plot? Do age and emission appear to be related?arrow_forward
- Assume now that taking into account the genders of the persons whose heights were given inQuestion 1, we get the following sets: Height in centimeters – males171 178 157 171 175 182 162 167 166170 154 190 156 180 166 184 161 159Height in centimeters – females152 149 158 166 150 144 167 152 153152 165 154 162 166 153 157 161 152 (a) Construct a side-by-side stem-and-leaf plot for the two data sets. (b) Draw an overlay frequency polygon comparing the two data sets. Use the same classes asin Question 1. (c) What conclusion may we draw about relative heights of males and females in this sample? Justify your answer!arrow_forwardWhen an anthropologist finds skeletal remains, they need to figure out the height of the person. The height of a person (in cm) and the length of their metacarpal bone (in cm) were collected for 18 sets of skeletal remains. The data are in the table below. X, length of metacarpal (in cm) Y, height (in cm) 51 180 45 173 47 175 42 165 44 171 40 163 42 175 44 173 39 159 45 173 46 175 52 176 50 181 50 178 49 170 46 173 38 157 49 185 a) State the random variables. rv X = of rv Y = of b) Make a scatterplot of X versus Y in StatCrunch (optional). Why do we wish to sketch a scatterplot? c) Find the equation of the best-fitting line (the least squares regression equation). Round values to 2 decimal places. Include the restricted domain. equation: = + * X restricted domain: cm <= X <= cm d) Interpret the slope from part c in the context of this problem. (Pay…arrow_forwardIn forestry, the diameter of a tree at breast height is used to model the height of the tree. Silviculturists working in British Columbia’s boreal forest conducted a series of spacing trials to predict the heights of several species of trees. The data are the breast height diameters (in centimeters) and heights (in meters) for a sample of 18 white spruce trees. B1 B2 18.9 20.0 15.5 16.8 19.4 20.2 20.0 20.0 29.8 20.2 19.8 18.0 20.3 17.8 20.0 19.2 22.0 22.3 16.6 18.8 15.5 16.9 13.7 16.3 27.5 21.4 20.3 19.2 22.9 19.8 14.1 18.5 10.1 12.1 5.8 8.0 B1: Breast Height Diameter of White spruce (cm) B2: Height (m) a) Plot the relationship using scatter diagram between the breast height diameters and the trees’ height. Are the breast height diameters and the trees’ height linearly related? What can you infer about the relationship between the two variables? Is a linear model appropriate? b) Compare the scatter plot in (a) with the correlation coefficient…arrow_forward
arrow_back_ios
SEE MORE QUESTIONS
arrow_forward_ios
Recommended textbooks for you
 Discrete Mathematics and Its Applications ( 8th I...MathISBN:9781259676512Author:Kenneth H RosenPublisher:McGraw-Hill Education
 Mathematics for Elementary Teachers with Activiti...MathISBN:9780134392790Author:Beckmann, SybillaPublisher:PEARSON
 Thinking Mathematically (7th Edition)MathISBN:9780134683713Author:Robert F. BlitzerPublisher:PEARSON
 Discrete Mathematics With ApplicationsMathISBN:9781337694193Author:EPP, Susanna S.Publisher:Cengage Learning,
 Pathways To Math Literacy (looseleaf)MathISBN:9781259985607Author:David Sobecki Professor, Brian A. MercerPublisher:McGraw-Hill Education
Discrete Mathematics and Its Applications ( 8th I...
Math
ISBN:9781259676512
Author:Kenneth H Rosen
Publisher:McGraw-Hill Education
Mathematics for Elementary Teachers with Activiti...
Math
ISBN:9780134392790
Author:Beckmann, Sybilla
Publisher:PEARSON
Thinking Mathematically (7th Edition)
Math
ISBN:9780134683713
Author:Robert F. Blitzer
Publisher:PEARSON
Discrete Mathematics With Applications
Math
ISBN:9781337694193
Author:EPP, Susanna S.
Publisher:Cengage Learning,
Pathways To Math Literacy (looseleaf)
Math
ISBN:9781259985607
Author:David Sobecki Professor, Brian A. Mercer
Publisher:McGraw-Hill Education
Points, Lines, Planes, Segments, & Rays - Collinear vs Coplanar Points - Geometry; Author: The Organic Chemistry Tutor;https://www.youtube.com/watch?v=dDWjhRfBsKM;License: Standard YouTube License, CC-BY
Naming Points, Lines, and Planes; Author: Florida PASS Program;https://www.youtube.com/watch?v=F-LxiLSSaLg;License: Standard YouTube License, CC-BY